
Figure 1.
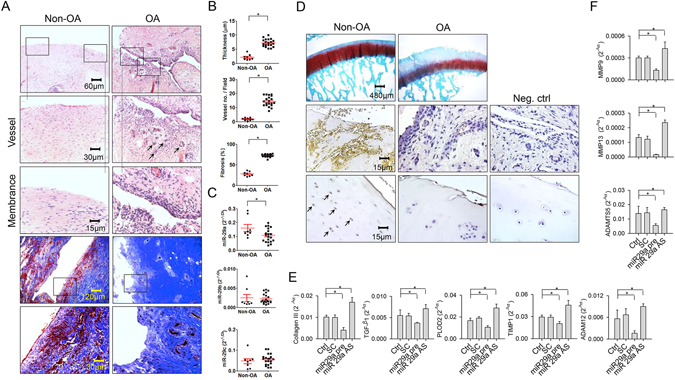
Analyses of fibrotic reactions in end-stage OA synovial tissues and fibroblast cultures. (A) Histochemical images of synovial hyperplasia, hyperangiogenesis (arrows), and fibrotic tissue positive for Masson’s trichrome stain in the end-stage OA group. Panels in the low power field images indicate areas of interest for high power field images. (B) OA group showed increases in synovial membrane thickness, vessel formation, and fibrosis tissue area. (C) OA synovial tissues exhibited high miR-29a but not b, c expression. (D) The OA cartilage displayed weak Safranin-O staining. Synovial fibroblasts and chondrocytes (arrows) in the OA group displayed weak miR-29a transcripts. Data (mean ± standard error) are calculated from 20 patient with end-stage OA and 8 participants with non-OA injury and analyzed by a Wilcoxon test. miR-29a transfection reduced expression of (E) collagen III, TGF-β1, PLOD2, TIMP1, and ADAM12 in concomitant with (F) low expression of MMP9, MMP13 and ADAMTS5 in synovial fibroblasts. Loss of miR-29a signaling increased fibrogenic factor and proteinase expression in cell cultures. Synovial fibroblast experiments in triplicate were repeated 3 times. All investigations (mean ± standard error) of synovial fibroblasts were analyzed by a parametric analysis of variance (ANOVA) and a Bonferroni post-hoc test. Asterisks (*) stands for significant difference between groups.