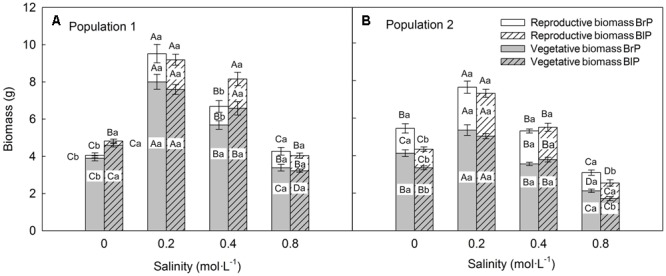
FIGURE 4.

Effects of soil salinity and seed morph on biomass allocation (mean ± 1 SE) of F1 (filial generation 1) plants of the two populations of Suaeda corniculata. Different letters above bars indicate significant differences (P < 0.05) in total biomass and different letters in bars significant differences (P < 0.05) in vegetative or reproductive biomass. Uppercase letters indicate differences across all salinity levels in the same seed morph and lowercase letters differences between seed morphs for the same salinity level. BrP, plants from brown seeds; BlP, plants from black seeds.
