Figure 4.
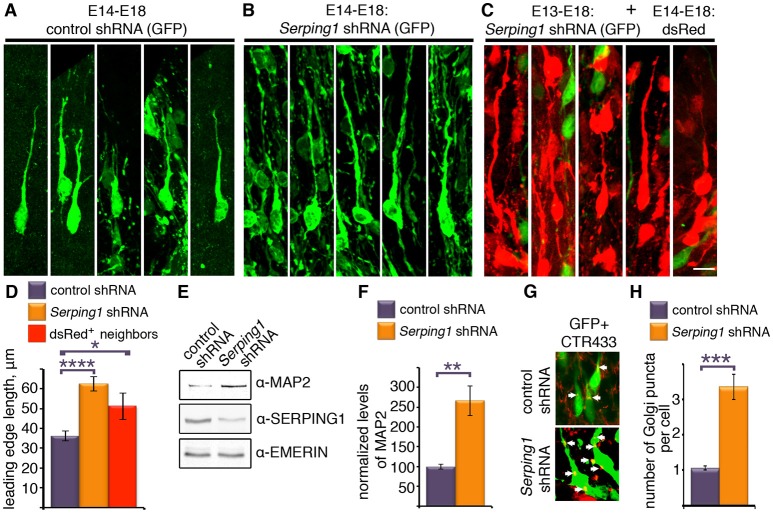
Serping1 influences neuronal morphology in a cell-autonomous and non-cell autonomous way. (A–D). Brains were in utero electroporated with control shRNA (A) or Serping1 shRNA (B) together with GFP (E14-E18). Representatives of individual cells from the IZ are shown (C). Brains were in utero electroporated with Serping1 shRNA on E13 and with dsRed on E14. DsRed positive cells arrested in IZ (E18) are shown. The length of the leading edge was measured on high-magnification 3D reconstruction images with ImageJ software. The lengths of the leading edges were compared between the conditions (D). One-way ANOVA, Turkey HSD, n = 16, *p < 0.05, ****p < 0.0001. The scale bar is 10 μm. (E,F) Brains were in utero electroporated with control shRNA or Serping1 shRNA together with GFP (E14-E17). The electroporated areas were dissected under fluorescent binocular. The dissected areas were lysed and western blotted using anti-MAP2, anti-SERPING1 and anti-EMERIN antibodies. The levels of MAP2 were normalized to EMERIN. Levels of MAP2 relative to control (in %) are presented (F). n = 3, Student t-test, **p < 0.01 (G–H). Golgi analysis in Serping1 knockdown compared to control. Control shRNA or Serping1 shRNA electroporated brain sections (E14-E18) were immunostained with Golgi marker antibodies (CTR433). Immunostaining of the Golgi are presented together with GFP. White arrows show position of Golgi. The scale bar is 10 μm. Quantification of the number of Golgi clusters per cell (n = 20, Student t-test) are shown (H) ***p < 0.001.

