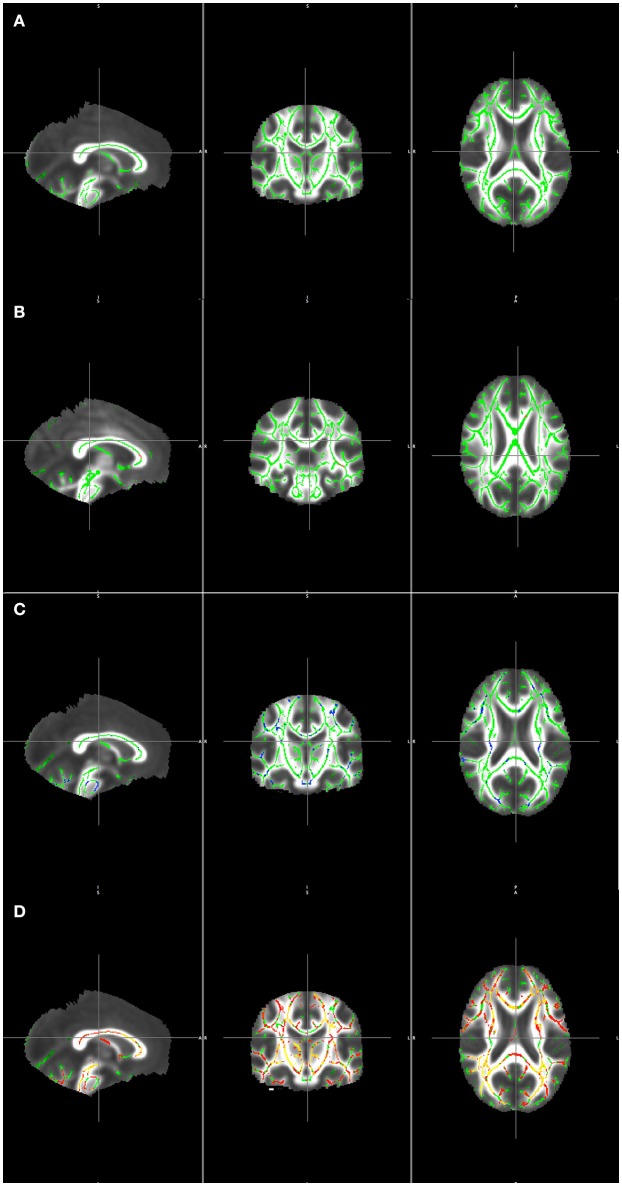
Figure 2.
Visualization TBSS detection results masked by the F-test overlaid on the mean of registered FA volumes. (A) Mean skeleton (green). (B) F statistics (red-yelow) over the mean skeleton (green). (C) Clusters detected from contrast AD > LOBD masked by F-test clusters (blue) overlaying the mean skeleton (green). (D) Clusters detected from contrast LOBD > AD masked by F-test clusters (red) overlaying the mean skeleton (green).

