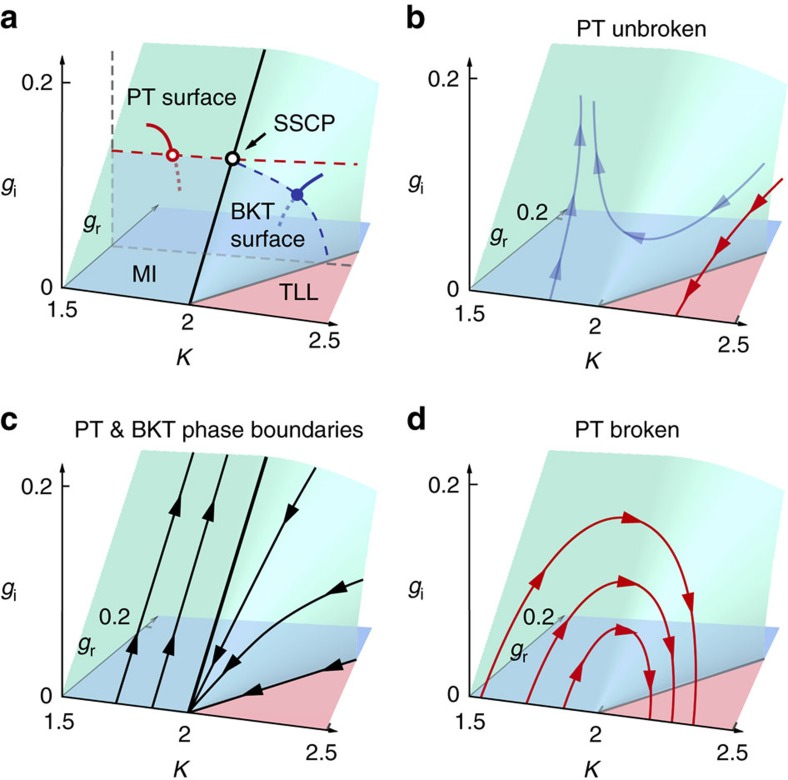
Figure 1. Quantum critical phenomena in PT-symmetric many-body systems.
(a) 3D phase diagram of a PT-symmetric many-body system in the parameter space (K, gr, gi). Here K and gr (gi) characterize the strength of the inter-particle interaction and the depth of the real (imaginary) part of a complex potential, respectively. The MI and TLL phases are separated by the surface of the BKT transition for K>2 and that of the PT transition for K<2. An example of the BKT (PT) transition is illustrated by the blue (red) curve with the transition point indicated by the filled (open) circle. The MI (TLL) phase corresponds to the 3D region containing the blue (red) shaded plane at gi=0. On the critical line with K=2 lies a SSCP (black open circle). Dashed lines indicate the phase boundaries on the plane with fixed gr for comparison with numerical results in Fig. 2a. (b) Hyperbolic RG flows in a PT-unbroken region (gi<gr), which reproduce the conventional flow diagram in the sine-Gordon model. (c) RG flows on the two phase boundaries separated by an unconventional fixed line (thick black line). (d) Unconventional semicircular RG flows in a PT-broken region (gi>gr). Along each flow, the TLL parameter K monotonically increases, indicating the anomalous enhancement of the superfluid correlation.

