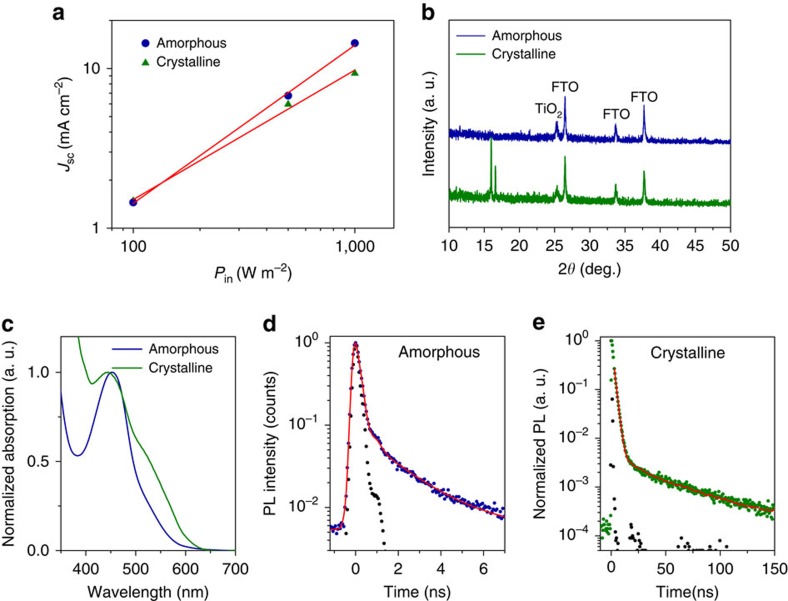
Figure 3. Comparison of amorphous and crystalline Cu(II/I) hole conductor.
(a) Incident light intensity (Pin)-dependent Jsc of solid-state DSCs with amorphous and crystalline hole conductors. The red lines are linear fits of the data. (b) X-ray diffraction of amorphous and crystalline Cu(II/I) hole conductors in conjunction with Y123-sensitized TiO2 film on FTO glass substrate. (c) Absorption spectra for the amorphous and crystalline Cu(II/I) hole conductors. (d) Photoluminescence decay dynamics of amorphous Cu(II/I) hole conductor. (e) Photoluminescence decay dynamics of crystalline Cu(II/I) hole conductor. The traces were collected at 670 nm with photoluminescence maximum following nanosecond laser pulsed excitation at 408 nm. The black dot symbols are instrument response function. The red lines are bi-exponential fits of the data.

