
Figure 3. Rare codons limit KRAS-mediated resistance to cetuximab in colorectal cancer.
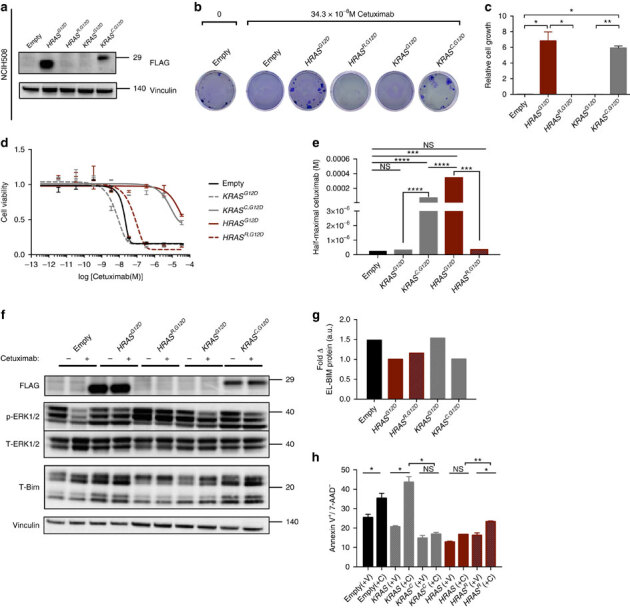
(a) Immunoblot analysis with anti-FLAG or anti-vinculin antibody in NCIH508 cells stably transduced with a vector encoding the indicated transgene (or no transgene, empty). All HRAS and KRAS constructs are FLAG tagged. (b) Representative plate of three technical replicates of colony growth assay of various HRAS and KRAS expressing derivatives in the presence of cetuximab or vehicle control. (c) Number of colonies in b normalized to cells expressing no transgene, determined when the indicated cell line transduced with vectors encoding the indicated transgenes were treated with cetuximab. (d) Nonlinear regression growth curves depicting cell viability as detected by Cell Titer Glo of cells transduced with indicated constructs and treated with an eight-log dilution series of cetuximab. (e) Derived half-maximal growth inhibition values of curves in d. (f) Immunoblotting of indicated constructs for signalling of phospho- and total-ERK1/2 and T-BIM. All HRAS and KRAS constructs are FLAG tagged as in a, and vinculin is a loading control. (g) Fold change in extra long-BIM (EL-BIM) protein levels from the immunoblots in f comparing cetuximab and vehicle treated cells. (h) Apoptosis quantification (Annexin V+/7-AAD−) of indicated constructs in the presence or absence of cetuximab. In all cases, data are average±s.e.m. (n=3 technical replicates per condition). Immunoblotting images are cropped for clarity. *P≤0.05; **P≤0.01; ***P≤0.001, ****P≤0.0001. P values were calculated with unpaired, two-tailed Student's t-tests.