
Figure 6. Translation-dependent state of KRASG12/G13-mutant cells enables selective targeting of anti-EGFR resistant colorectal cancer.
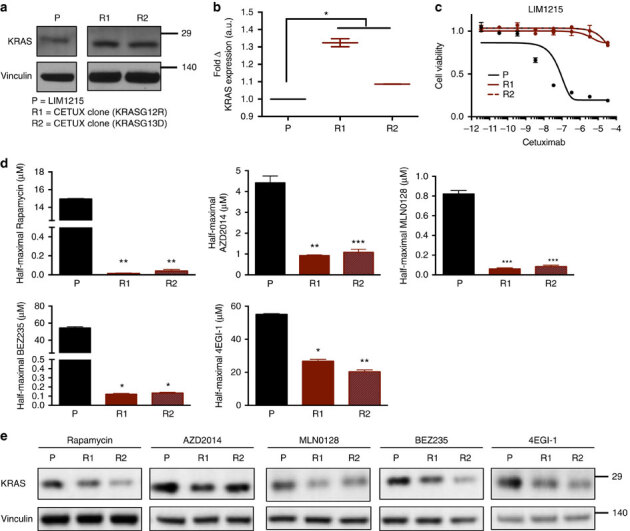
(a) Immunoblot analysis for endogenous KRAS levels in parental (P) and derived KRAS mutant, cetuximab-resistant (R1 and R2) clones. (b) Fold change in KRAS protein levels, normalized to loading control, between resistant derivatives (R1 and R2) and parental cells (P). (c) Nonlinear regression growth curves depicting cell viability as assessed by Cell Titer Glo (CTG) of parental (P) and matched resistant derivatives (R1 and R2) treated with cetuximab. (d) Derived half-maximal growth inhibition values of parental (P) and matched resistant derivatives (R1 and R2) treated with Rapamycin, AZD2014, MLN0128, BEZ235 and 4EGI-1. (e) Immunoblot analysis of KRAS protein levels in parental (P) and resistant derivatives (R1 and R2) following 4 h treatment with the corresponding inhibitors in d. Images are cropped for clarity from the same exposure of the same membrane. Error bars show data±s.e.m. (n=3 technical replicates per condition). *P≤0.05; **P≤0.01; ***P≤0.001. P values were calculated with unpaired, two-tailed Student's t-tests.