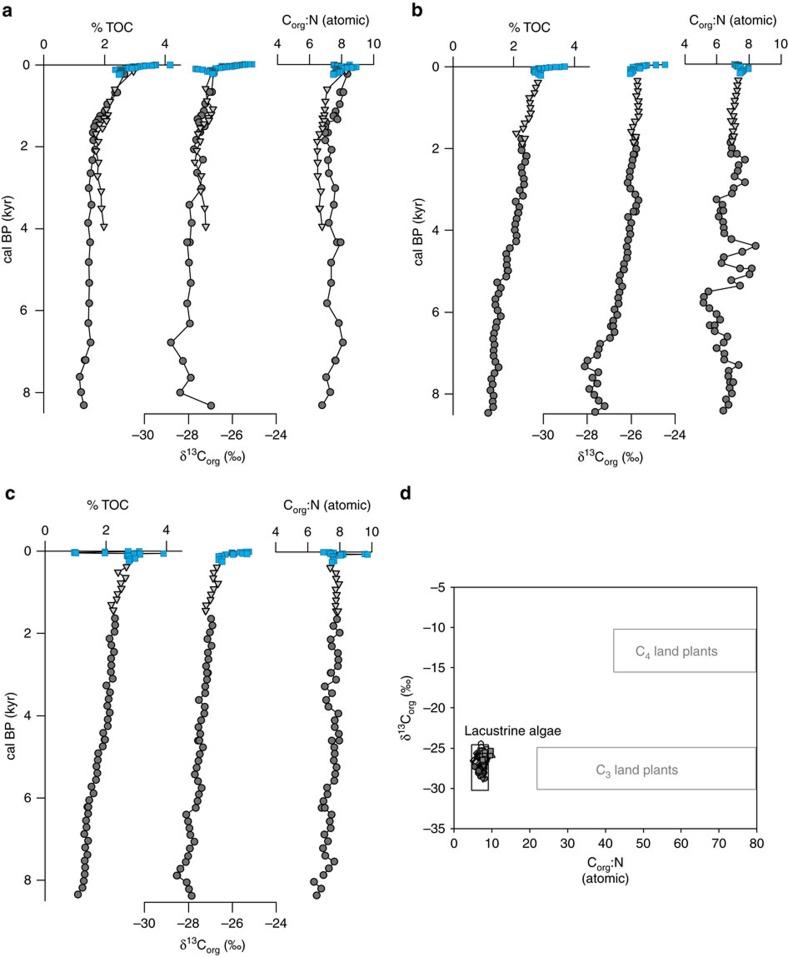
Figure 2. Paleoproductivity proxies plotted versus calendar years before 1950 for three locations in Lake Superior.
(a) Isle Royale; (b) Keweenaw; (c) Split Rock; (d) cross-plot of Corg:N versus δ13Corg showing values plot within the lacustrine algal range. Dark grey circles are data from the piston cores, light grey triangles are data from the gravity cores, blue squares are data from the multicores. %TOC is plotted as a wt./wt. ratio of dry sediment, Corg:N as atomic ratios and δ13Corg as per mil (‰) relative to the standard—Vienna PeeDee Belemnite (VPDB).

