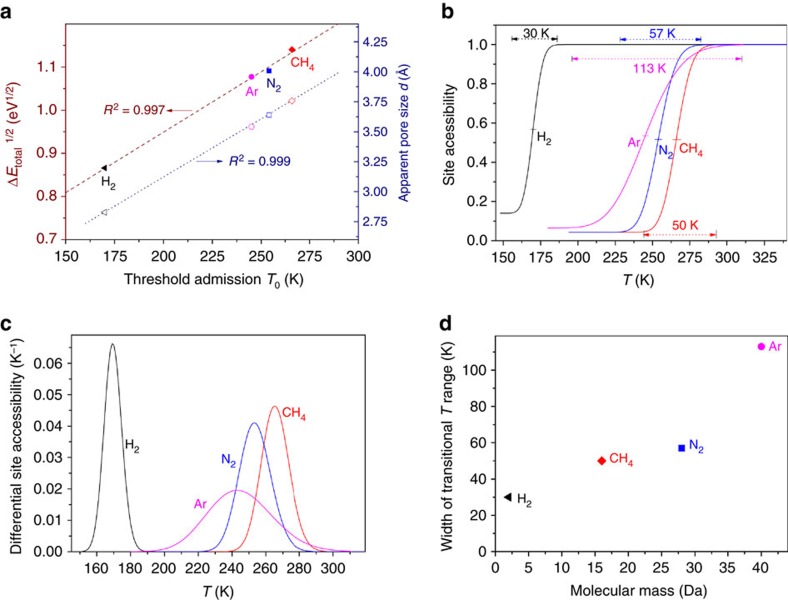
Figure 4. Physical significance of the temperature-regulated guest admission model parameters.
(a) Left axis: Linear correlation between the square root of the total energy barrier ΔEtotal and the threshold guest admission temperature T0, indicating a consistency between the DFT calculations, framework used to derive the LJM model, and the experimental data. Right axis: linear relationship between T0 and the apparent pore size of r2KCHA based on the guest molecule's kinetic diameter10,12. (b) Accessibility of adsorption sites as a function of temperature for guest molecules of H2, CH4, N2 and Ar as calculated by  in equation (6). The lower and upper cut-offs are 0.1 and 99.9% of the accessibility of the internal sites, respectively, and the initial value of the curve represents the fraction of external sites ɛ. (c) Corresponding differential site accessibility for the four different guest molecules on r2KCHA. (d) Corresponding width of the transitional temperature range (as characterized by β in the LJM model) for the admission of different guest species, showing heavier molecules tend to have larger distribution widths.

