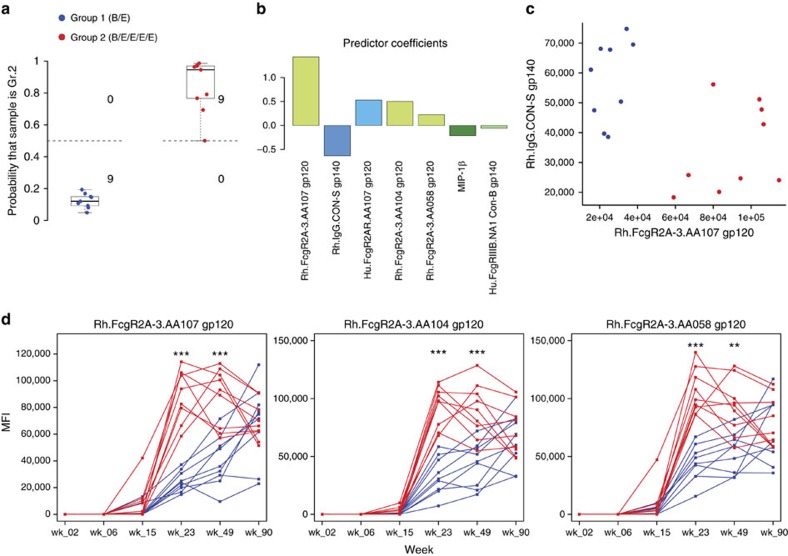
Figure 4. Bivalent and pentavalent vaccines elicited different antibody responses that evolved over time.
(a) Probability of each sample to be predicted as belonging to the pentavalent group. The decision boundary of the logistic classifier is shown at 0.5 (dashed line). (b) Logistic regression coefficients for the variables selected by the final LASSO-regularized model trained using all samples. The variables are ordered in descending order by magnitude of coefficient. (c) Bi-plot of the two variables with the highest magnitude coefficients in the final model. Each point represents a sample. (d) Temporal plots of variables correlated with the pentavalent group illustrating the evolution of group differences over time. The differences between groups, at each time point, were tested for significance with Wilcoxon–Mann–Whitney; *P<0.05, **P<0.01, ***P<0.001.

