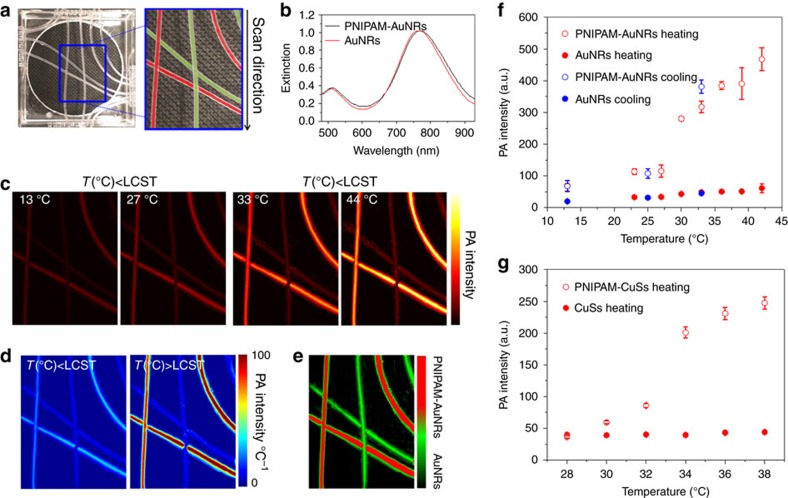
Figure 2. Photoacoustic imaging of nanoconstructs at temperatures from 13 to 44 °C.
(a) Photograph (left) of thin wall polyethylene tubes filled with PNIPAM-AuNR and pure AuNR solutions. The tube generates negligible photoacoustic signals. Photograph (right) is colour-coded: red indicates PNIPAM-AuNR, green indicates pure AuNR. (b) UV-Vis or Ultraviolet-visible extinction spectra indicate the matched extinction of AuNRs in both the nanoconstructs and the pure AuNR solutions at 760 nm. (c) Photoacoustic imaging of the tissue-mimicking phantom at temperatures 13, 27, 33 and 44 °C (two temperatures below LCST, and two above LCST). (d) Photoacoustic intensity slope images below and above LCST. The colour map shows the photoacoustic intensity change per change of temperature. Comparing the two imaging, it shows the slope of pure AuNR stays unchanged below and above LCST, whereas the slope of photoacoustic intensity from PNIPAM-AuNR changes dramatically. (e) Using the difference photoacoustic slopes from (d) to differentiate the PNIPAM-AuNR from AuNRs. (f) Comparison of photoacoustic intensities for PNIPAM-AuNR and pure AuNR with a heating and cooling cycle, indicating the curve retrieves back to its original photoacoustic intensity as temperature cools below LCST. Abrupt photoacoustic intensity changes are observed in both PNIMPAM-AuNR nanoconstructs and (g) PNIPAM- CuS nanoconstructs, whereas their pure nanoparticles (AuNR and CuS) show linear behaviour with respect to temperatures. For a fair comparison of the signals, the signal calibration in (f,g) is based on a phantom containing two parallel tubes. One tube contains the nanoconstructs and the other one contains pure AuNR or CuS nanopartilces with matched concentration. The positions of these two tubes are carefully leveled with ultrasound imaging; the difference of their positions relative to the transducer is <1 mm. The overall intensity is the integrated photoacoustic signal inside the whole tube in the field of view defined by ultrasound image. The concentration of the particle solutions are matched to OD=3.33 for 1 cm optical path in these measurements. The error bars in (f,g) represent the s.e. of mean of 300 frames of photoacoustic images.

