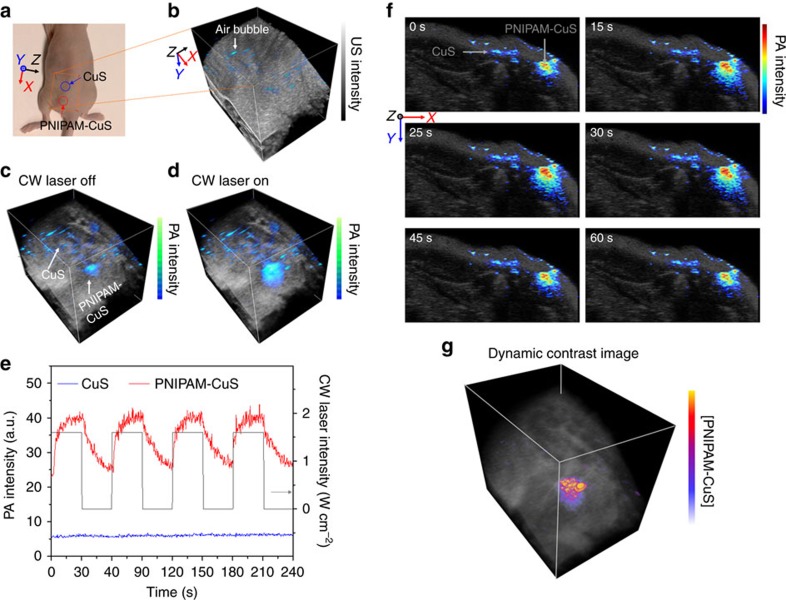
Figure 4. Ex vivo photoacoustic imaging of a mouse.
(a) An image of a mouse model with both CuS NSs and PNIPAM-CuS injected in the region marked by the circles. (b) Overlay of ultrasound and photoacoustic images show scattered air bubbles on the skin as a strong background noise before nanoparticle injection. (c) After nanoparticle injection, when the CW laser is off, the region with PNIPAM-CuS is clearly visualized, but the region with CuS NSs is relatively weak, and difficult to be distinguished from the bubble region. (d) When the CW laser is on, the photoacoustic intensity at the PNIPAM-CuS region is dramatically enhanced. (e) Multi-cycles of CW laser on and off shows the photoacoustic signals follow the CW laser on/off cycle dynamically. (f) Photoacoustic intensity recorded during a full cycle of CW laser on and off. (g) Dynamic contrast-enhanced photoacoustic image obtained by subtracting the photoacoustic intensity under CW laser-off from CW laser-on, removing the strong background noises from the tissues, CuS NPs and bubbles and unambiguously reveals the region with only the PNIPAM-CuS. The image volume in (b–d,g) is 23 × 20 × 25.8 mm3.

