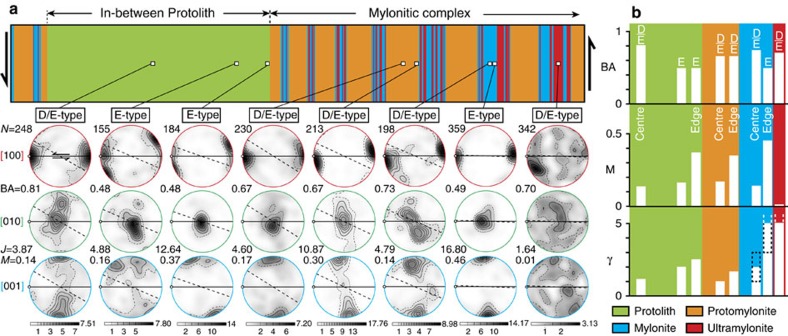
Figure 4. Olivine fabric across a mylonitic complex.
(a) Olivine lattice preferred orientation (LPO) across a mylonitic complex, including an in-between protolith. For the protolith, protomylonites and mylonites, we show LPO patterns from centre to edge. LPOs are displayed in equal-area lower-hemisphere pole figures with respect to the shear plane (horizontal line defined by ultramylonitic bands), shear direction (white dot) and foliation plane (dotted line) for the three principal axes of olivine ([100], [010] and [001]). The iso-contours and grey shading are multiples of a uniform distribution based on one point per grain (linear scale). While E-type fabric is identified at the edges of the protolith and mylonites, we observe a combination of E-type and D-type fabrics in other layers27,28,44. The BA index gives the degree of combination from ∼0.5 (E-type fabric) to 1 (D-type fabric)30. N=number of grains; J=texture index32; M=misorientation index33; X=shear direction; Z=pole to the shear plane. (b) From top to bottom, distribution of the BA index, M index and finite shear strain (γ)34 across the protolith and mylonitic complex. We only show the values from centre to edge for each type of layer. In mylonite and ultramylonite layers, the finite strain may strongly vary, including to values higher than 5 (dotted box).

