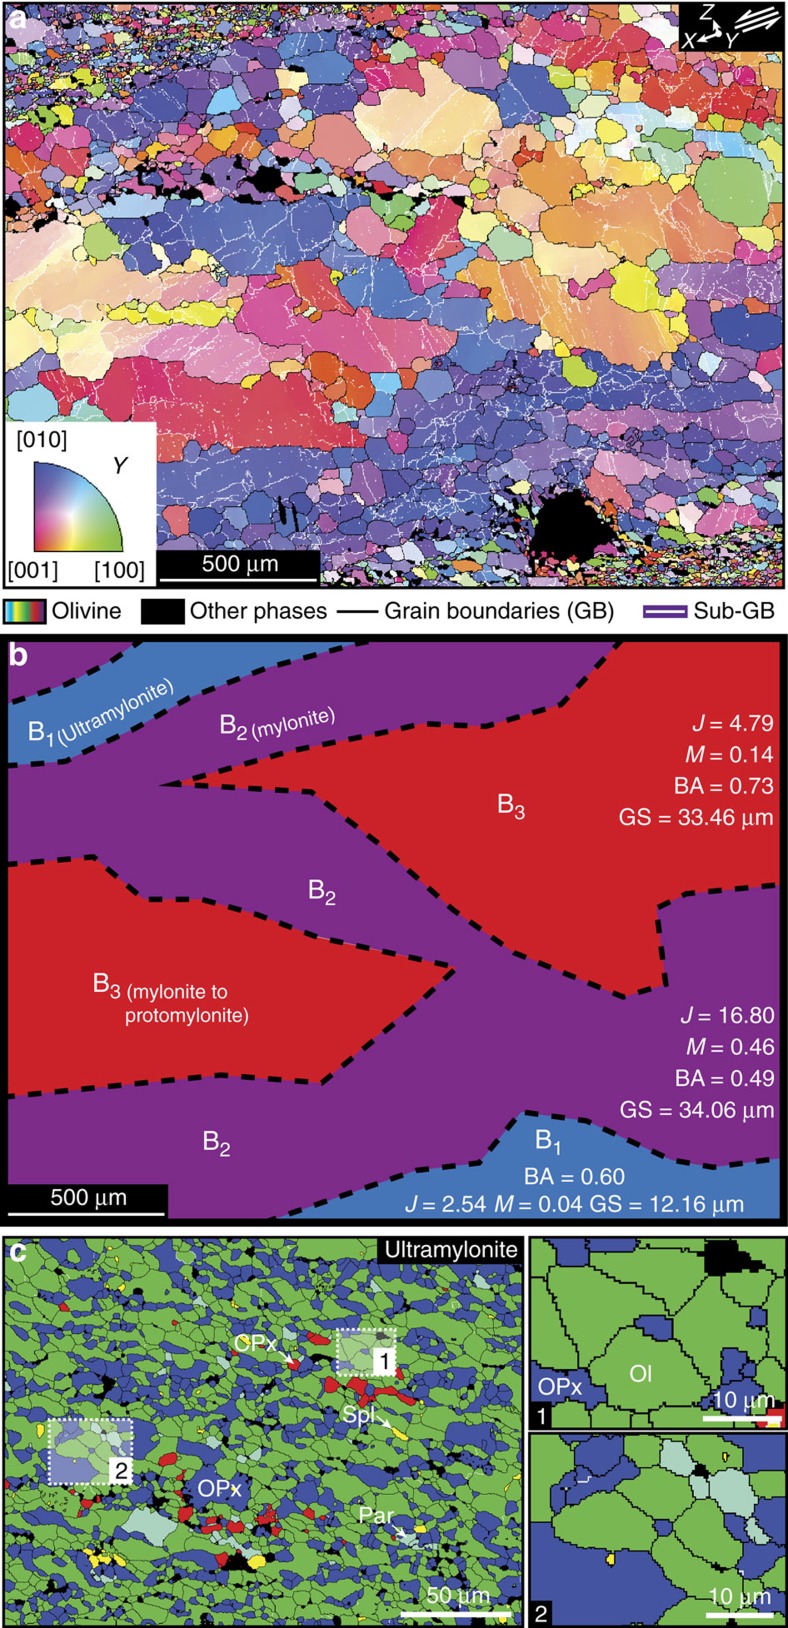
Figure 5. Olivine sub-grain boundaries and distribution of lattice misorientation distributions between ultramylonites.
(a) EBSD map coloured as a function of the inverse pole figure (bottom left inset) of the [100]-, [010]- and [001]-axes of olivine. The colour coding refers to the orientation of the olivine lattice with respect to the Y axis, that is, the deformation axis normal to the shear direction (X) and to the pole of the shear plane (Z). The black and white lines highlight grain boundaries (GB) and sub-grain boundaries (sub-GB), respectively (the parameters used to define GB and sub-GB are given in the methods section). Black areas are other phases and non-indexed points (see Supplementary Fig. 4). (b) Sketch of the different areas defined by the variation in olivine LPO in a, including ultramylonites (B1), adjacent connected bands in the mylonite (B2), and isolated areas between ultramylonites (B3). For each area, we give the texture index (J), misorientation index (M), BA index (BA) and mean olivine grain size (GS). The corresponding olivine LPOs are available in Supplementary Fig. 4. (c) Detailed EBSD map highlighting tiny phases of orthopyroxene (enstatite) surrounded by quadruple junctions of olivine grain boundaries. The location of the EBSD map is shown in Fig. 3a. Black area=pores; CPx=clinopyroxene; Ol=olivine; OPx=orthopyroxene; Par=pargasite; Spl=spinel.

