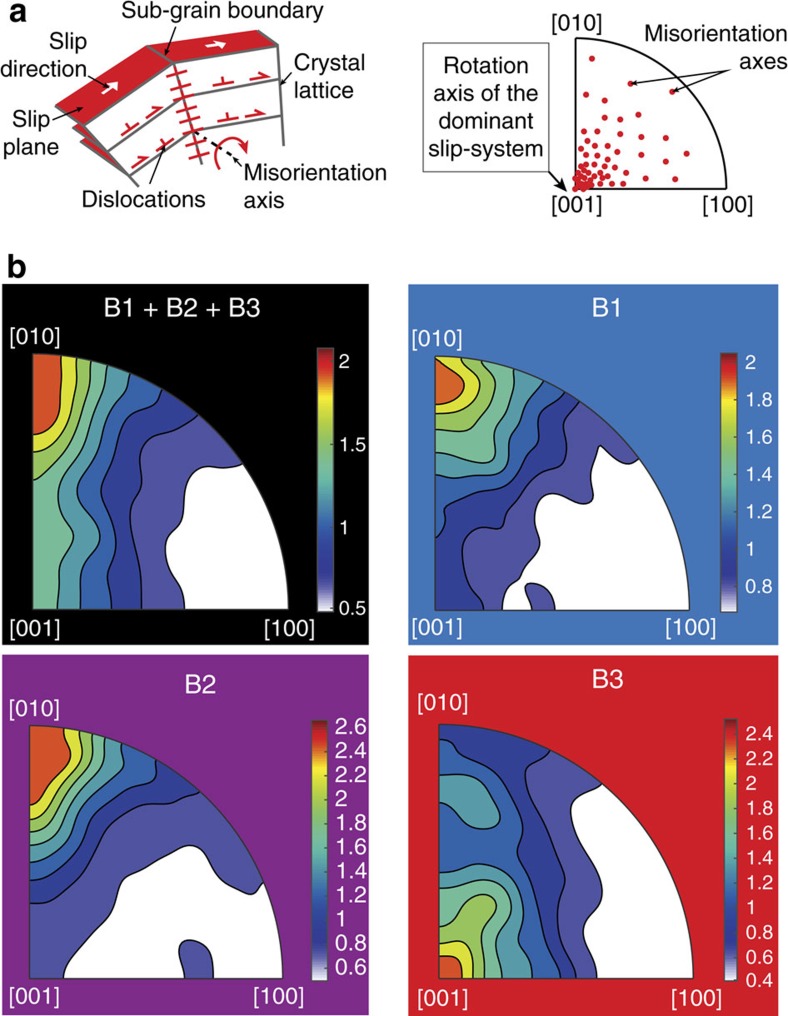
Figure 6. Olivine dislocation slip-systems deduced from the distribution of misorientation axes.
(a) Sketch illustrating characteristic features of sub-grain tilt boundaries. Inverse pole figures (IPFs) of the olivine axes ([100], [010] and [001]) provide information on the lattice rotation axis induced by the slip of dislocations on a lattice-controlled slip plane and slip direction, that is, on a specific slip-system35,36. (b) Olivine IPFs showing the distribution of correlated misorientation axes (between 2° and 10°) in olivine for each area illustrated in Fig. 5b, including the whole map (B1+B2+B3), ultramylonites (B1), purple bands (B2) and isolated areas (B3). The iso-contours and colour scale are multiples of a uniform distribution (linear scale). These IPFs show that isolated areas (B3) differ from the other areas (whole map, B1 and B2) in terms of the dislocation slip-system (see text).

