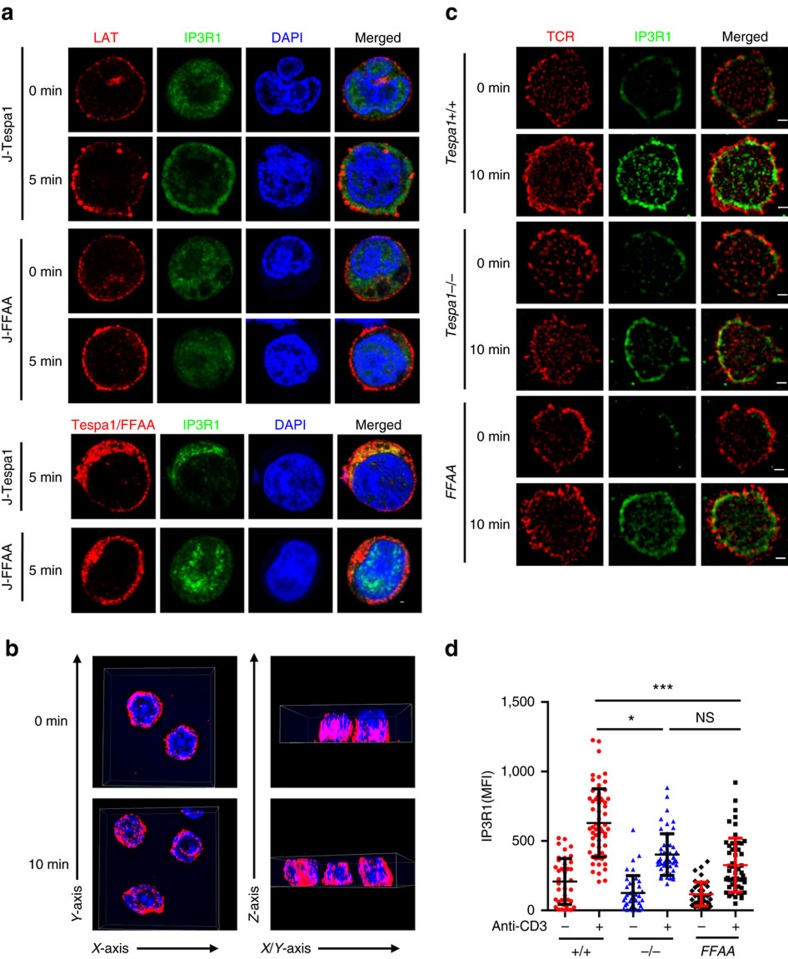
Figure 3. Recruitment of IP3R1 to TCR-proximal region by Tespa1.
(a) Confocal microscopy images of J-Tespa1 and J-FFAA cells labelled with anti-LAT (red), anti-IP3R1 (green), and DAPI (blue) before (0 min) and after (5 min) stimulation with soluble anti-CD3 and anti-CD28 antibodies. Scale bar, 1 μm. (b) WT thymocytes before (0 min) and after (10 min) stimulation with anti-CD3 immobilized on coverslips were stained with anti-IP3R1 antibodies, and then a 4 μm Z-stack 3D display was taken from contacting coverslip by Structured illumination microscopy (SIM). Left, a view from side of contacting coverslip. Right, a view upright to Z-axis. (c) SIM images of thymocytes from Tespa1+/+ (+/+), Tespa1−/− (−/−) and Tespa1-FFAA (FFAA) mice labelled with anti-IP3R1 (green) and Alexa Fluor 647-conjugated anti-TCR β (red) before (0 min) and after (10 min) stimulation with immobilized anti-CD3 antibodies (10 μg ml−1). Scale bar, 1 μm. (d) Mean fluorescence intensity (MFI) of IP3R1 from SIM analysis as in b. Each symbol represents an individual cell; small horizontal lines indicate the mean±s.d. One-way ANOVA was performed with a P value included. *P<0.05, ***P<0.001, NS, not significant. Data are representative of at least three experiments.

