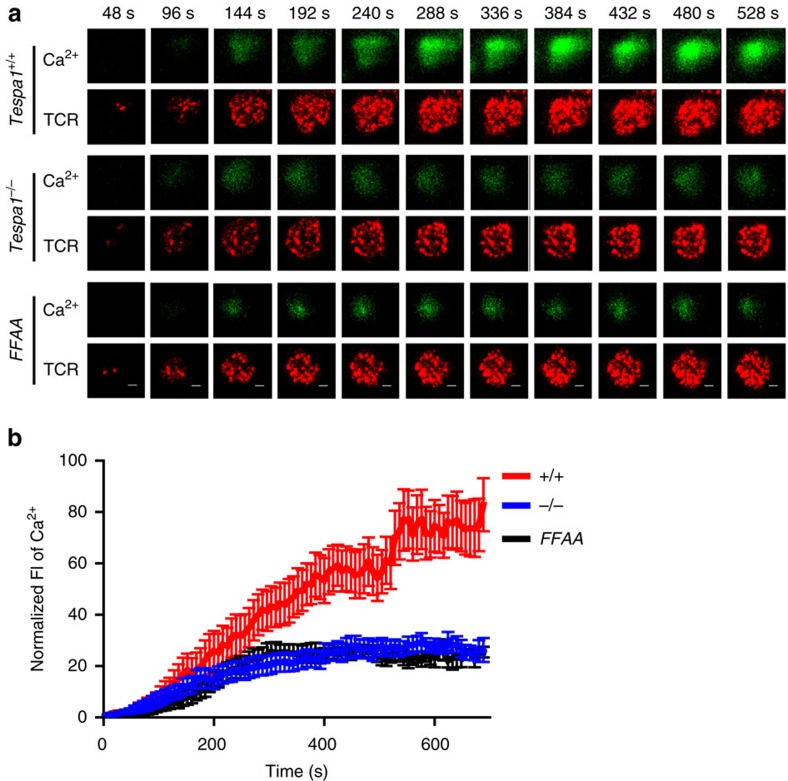
Figure 6. Impaired TCR-proximal calcium flux in Tespa1-FFAA T cells.
(a) Two-colour time-lapse TIRFM images of Fluo4 (green) and Alexa Fluor 647-Fab anti-TCR α/β (red) captured at the indicated time points (Supplementary Movie 1) from isolated Tespa1+/+, Tespa1−/− and Tespa1-FFAA (FFAA) DP cells placed on planar lipid bilayers containing anti-CD3 antibodies. See Supplementary Movie 1 for the complete time-lapse TIRFM images. Scale bar, 3 μm. (b) Normalized fluorescence intensity (FI) of Ca2+ imaging (Fluo4) from high-speed, high-resolution, time-lapse TIRFM images of real-time Ca2+ flux in the TCR-proximal region in isolated Tespa1+/+ (+/+), Tespa1−/− (−/−) and Tespa1-FFAA (FFAA) DP cells as in a. Data are representative of at least three experiments. Bars represent mean±s.e.m. of 10 (FFAA) or 12 (+/+ and −/−) cells from one representative of three independent experiments.

