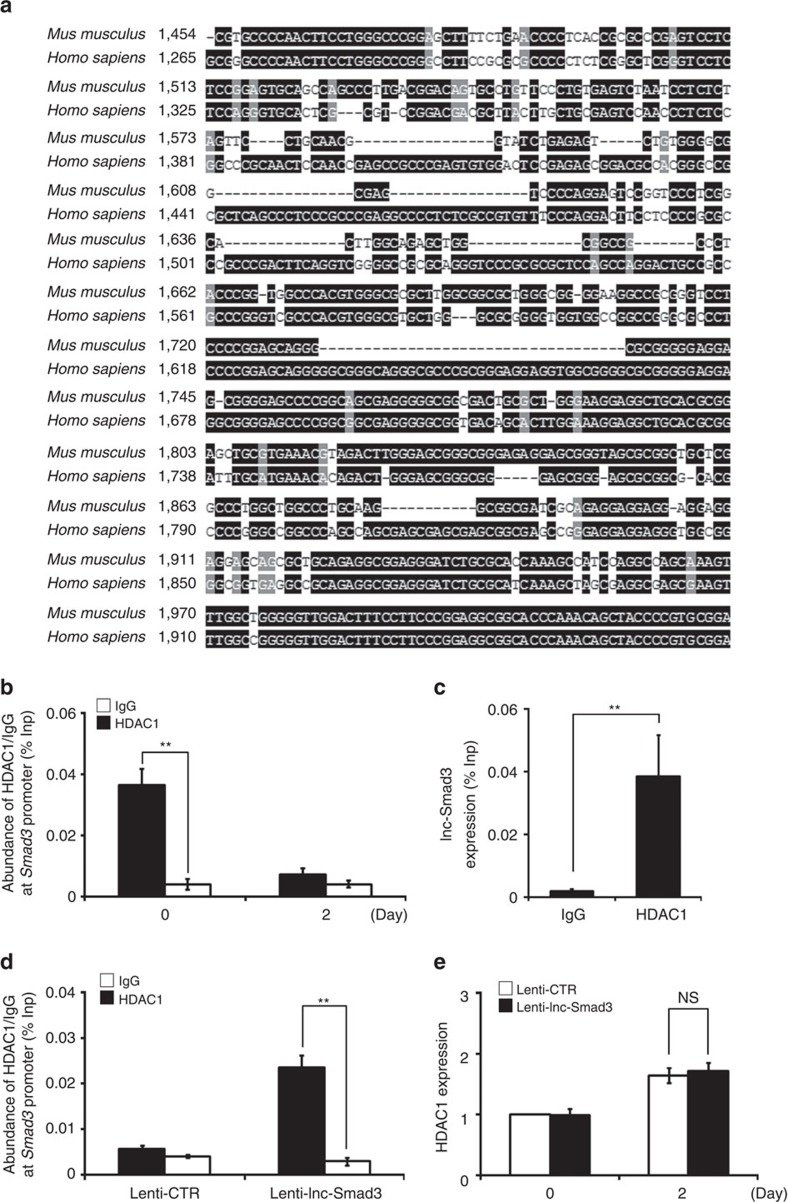
Figure 7. Lnc-Smad3 interacts with HDAC1 at the Smad3 promoter.
(a) A schematic outlining the conserved sequences of the Smad3 promoter regions in Mus musculus and Homo sapiens. (b) CHIP analysis of the accumulation of HDAC1 at Smad3 promoter region in naive CD4+ T cells and iTreg cells. Normalized data are shown as percentage of input control (% Inp). IgG serves as a CHIP control. (c) Quantitative PCR detection of the lnc-Smad3 retrieved by HDAC1 specific antibody compared with immunoglobulin G (IgG) in the RIP assay within CD4+ T cells. Normalized data are shown as percentage of input control (% Inp). IgG serves as a RIP control. (d) CHIP analysis of the accumulation of HDAC1 at Smad3 promoter region in CD4+ T cells transduced with a control lentivirus (Lenti-CTR) or lnc-Smad3-expressing lentivirus (Lenti-lnc-Smad3) and cultured under iTreg cell-skewing conditions (with TGF-β) for 2 days. Normalized data are shown as percentage of input control (% Inp). IgG serves as a CHIP control. (e) Relative expression of HDAC1 in CD4+ T cells transduced and cultured as in d. Results are relative to the baseline expression of HDAC1 in unstimulated CD4+ T cells transduced with Lenti-CTR, set as 1. Error bars represent s.d. Student's t test. **P<0.01. NS, not significant. All data are from three independent experiments (mean±s.d. of technical triplicates).

