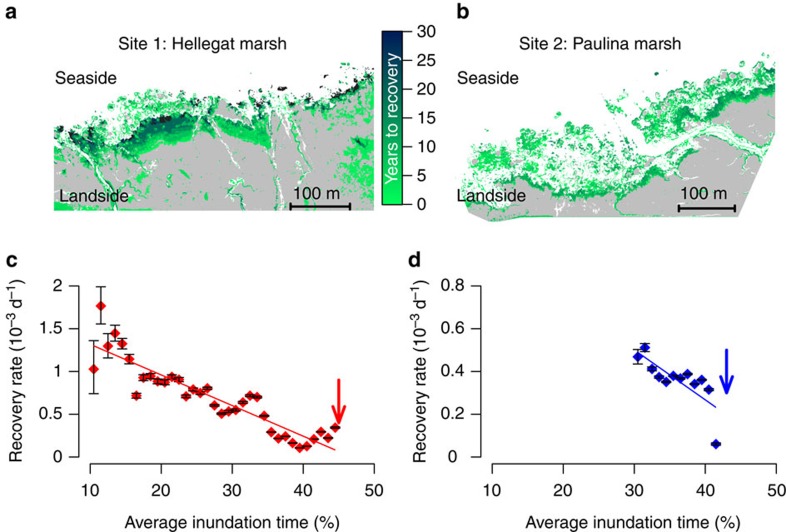
Figure 2. Remotely sensed vegetation recovery along a gradient of seawater inundation.
(a,b) The spatial distribution of the average time (in years) needed for vegetation to recovery after a perturbation in two Dutch tidal marsh sites. (c,d) Estimated recovery rates as a function of the average (multi-annual) inundation time revealing critical slowing down of vegetation recovery with increasing inundation time. Grey area (in a, b) represents never disturbed stable marsh vegetation, white area is the unvegetated tidal flat. Red symbols (c) depict recovery rates at site 1 ‘Hellegat' (NL), blue symbols (d) are rates at site 2 ‘Paulina' (NL) and error bars depict c.i. Arrows depict the critical condition of marsh vegetation. Linear regression: site 1, R2=0.83, P<0.001; site 2, R2=0.59, P<0.005.

