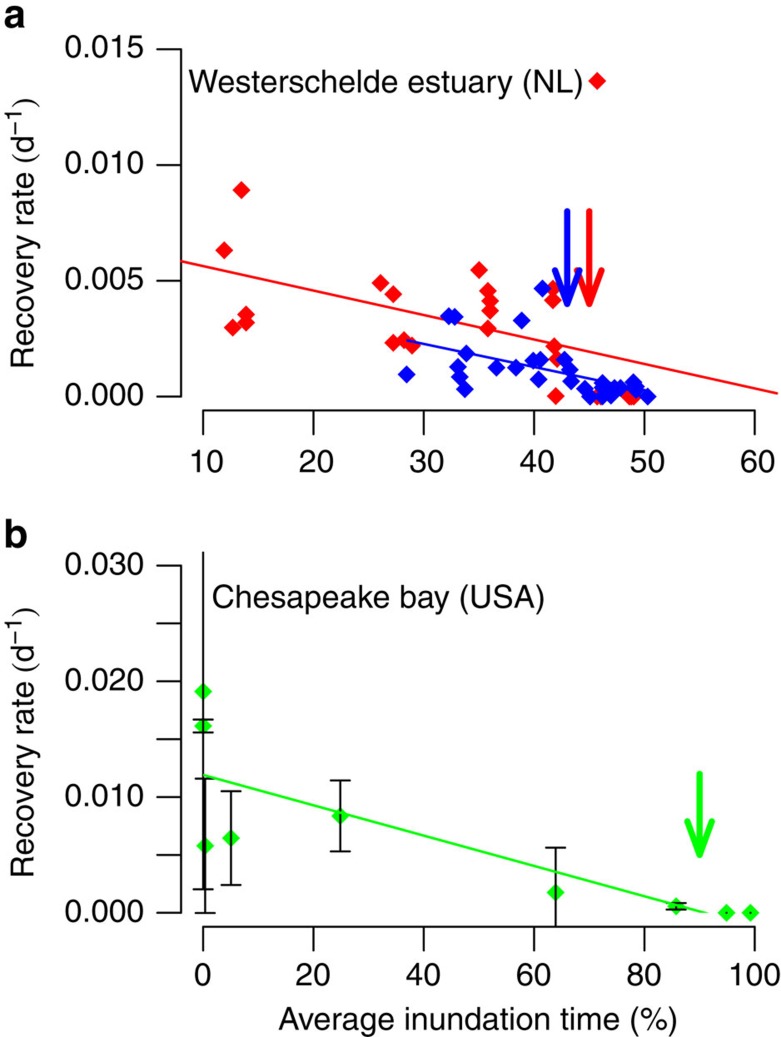
Figure 3. Experimental recovery rates of tidal marsh vegetation.
(a) Biomass recovery after mowing (disturbance) within one growing season in two Dutch tidal marsh sites. (b) Recovery after mowing within one growing season in the North American experiment. Red symbols indicate measurements at site 1 ‘Hellegat' (NL), blue symbols are from site 2 ‘Paulina' (NL), and green symbols site 3 ‘Blackwater' (USA). Arrows depict the critical condition of marsh vegetation. (Linear regression: site 1, R2=0.18, P=0.02; site 2, R2=0.28, P<0.005; US site 3, R2=0.66, P<0.01.) Error bars depict s.e.m.

