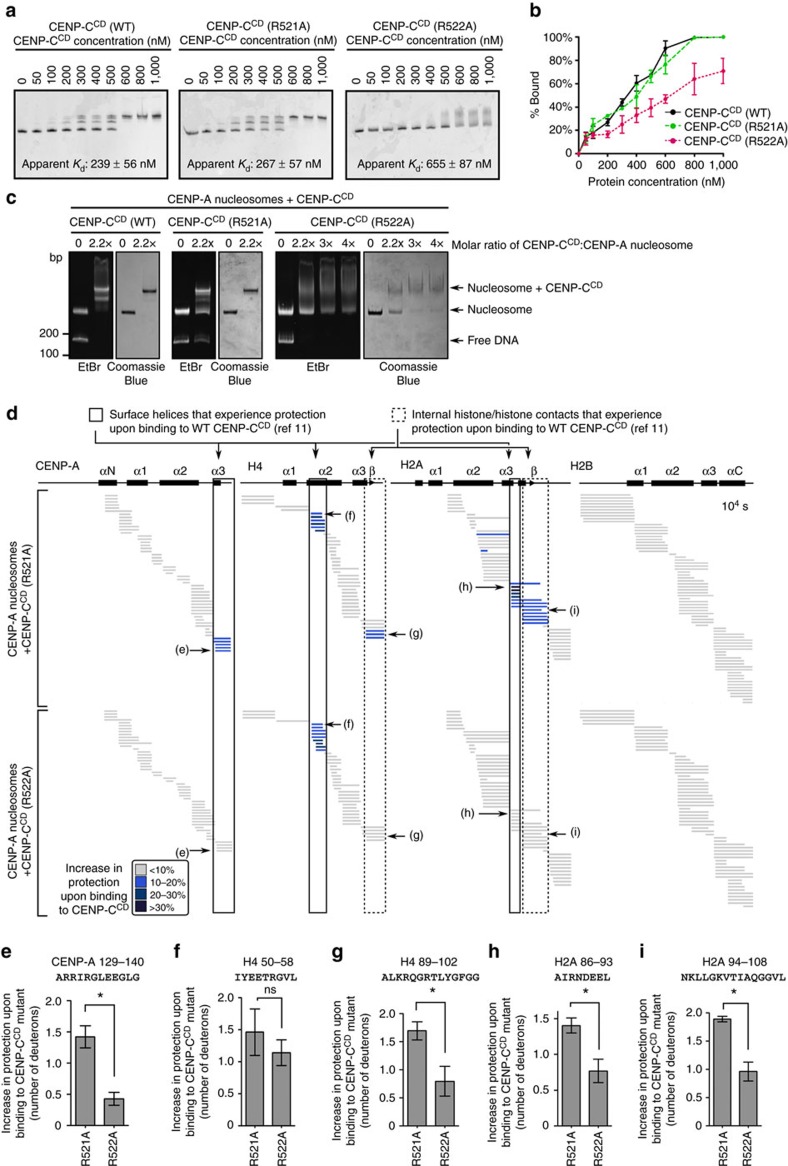
Figure 2. The arginine anchor of CENP-CCD is critical for the CENP-A nucleosome structural transition.
(a) Representative native PAGE analysis of CENP-A NCPs harbouring Cy5-labelled histone H2B that have been incubated with the indicated concentrations of CENP-CCD (WT or the indicated mutants). Each reaction contains 200 nM nucleosomes. Cy5 fluorescence was detected on a Typhoon phosphorimager, and CENP-C binding retards the mobility. Both WT and R521A show crisp shifts to bands with one or two copies of CENP-C bound to the nucleosome. R522A exhibits a more smeary appearance when bound to the CENP-A nucleosome (see also c), and the species with a single molecule of CENP-CCD(R522A) was not clearly resolved. Listed on the graphs are apparent Kd values for these binding experiments (values shown are mean±s.d.; n=3). (b) Quantification of three independent experiments (values shown are mean±s.d.) performed as in a. Note that for some data points, the error bars are too small to be visible in the graph. (c) CENP-A NCPs in complex with WT or mutant CENP-CCD, as assessed by native PAGE stained with ethidium bromide (EtBr) and then Coomassie Blue. (d) HXMS of all histone subunits of the CENP-A NCP from a single timepoint (104 s), showing regions that exhibit additional protection from HX upon binding of CENP-CCD(R521A) or CENP-CCD(R522A). Each horizontal bar represents an individual peptide, placed beneath the schematics of secondary structural elements of the CENP-A nucleosome. When available, we present the data from all measurable charge states of each of the unique peptides (here and in the similarly formatted plots in the experiments presented in Figs 4, 5, 6). (e–i) Representative peptides from various histone regions, comparing protection from exchange when the nucleosome is bound to CENP-CCD R521A versus R522A, showing faithful detection of differences between the two mutants across multiple replicate experiments (plotted as the mean±s.d.; n=3). Asterisks denotes differences that are statistically significant (P<0.05; Student's t-test).

