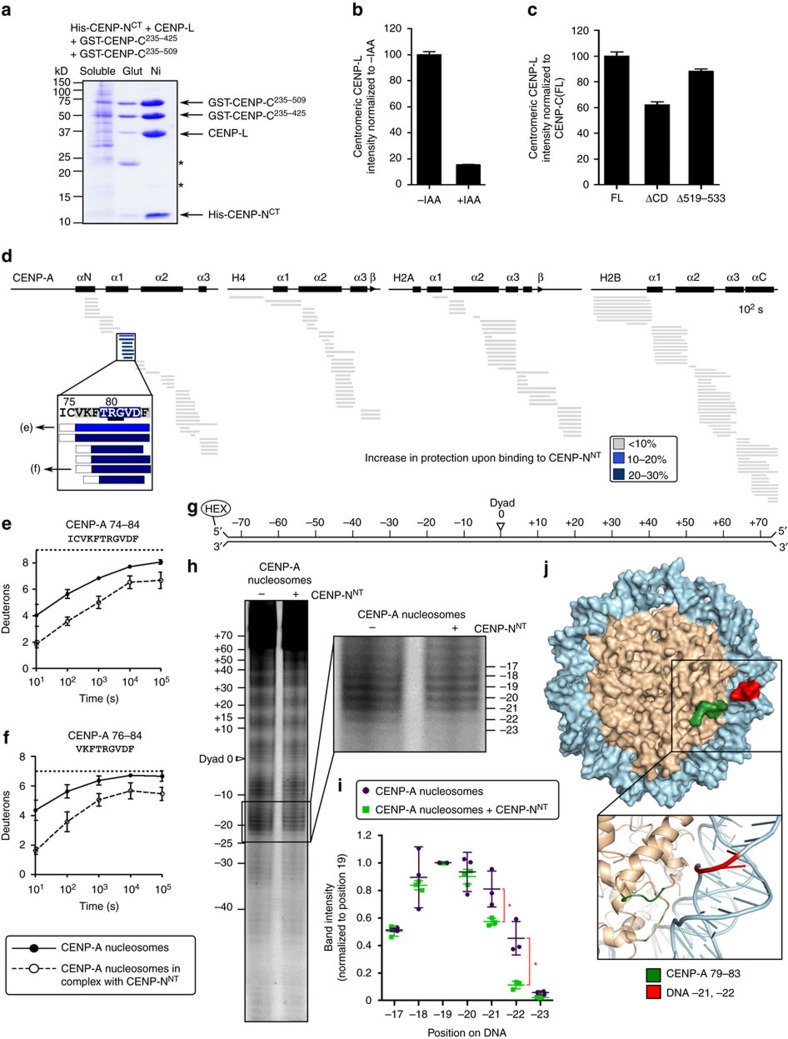
Figure 4. CENP-NNT crossbridges CENP-A to DNA.
(a) Coomassie Blue-stained SDS–PAGE of co-purification with described protocol18 of CENP-L/His-CENP-NCT with GST-CENP-C235–509 and GST-CENP-C235–425 by glutathione-agarose (Glut) or Nickel-NTA-agarose (Ni). (b) Localization of CENP-L-N in CENP-CAID-EYFP/AID-EYFP cells before and after 24 h of IAA treatment, assessed using anti-CENP-L18 (Supplementary Fig. 3b for images). (c) Localization of CENP-L-N in CENP-CAID-EYFP/AID-EYFP cells constitutively expressing the rescue constructs CENP-C(FL), CENP-C(ΔCD) or CENP-C(Δ519–533), after 24 h of IAA treatment. (Supplementary Fig. 3c for images) All graphs are shown as mean±95% confidence interval (n>2,000 centromeres in all cases). (d) HXMS of all histone subunits of the CENP-A NCP from a single timepoint (102 s), showing protection at CENP-A(79–83) upon binding to CENP-NNT. The first two residues of each peptide are boxed in dashed black lines because exchange of the first two backbone amide protons cannot be measured64. (e,f) Representative peptides spanning the CENP-A surface bulge over the timecourse. The maximum number of deuterons possible to measure by HXMS for each peptide is shown by the dotted line. All peptides are plotted at every timepoint as mean±s.d. from triplicate experiments. Note that for some data points, the error bars are too small to be visible in the graph. (g) Schematic representation of the 5′-fluorescently labelled 147 bp α-satellite DNA sequence used in footprinting experiments. (h) Representative hydroxyl radical footprinting experiment of CENP-A nucleosomes vs. CENP-A nucleosomes in complex with CENP-NNT, with inset showing magnification of positions −17 to −23. (i) Quantification of band intensities from three independent experiments, shown as mean±s.d. normalized to DNA position −19 (this position was chosen because it was expected to be very exposed for hydroxyl radical-mediated cleavage with and without CENP-NNT). Asterisks denotes differences that are statistically significant (P<0.05; Student's t-test). (j) A molecular model of the CENP-A nucleosome (PDB 3AN2)41, in which the DNA sequence was modified20 to that used in the footprinting experiment: CENP-A a.a. 79−83 is labelled in green, and DNA positions −21 and −22 are labelled in red.

