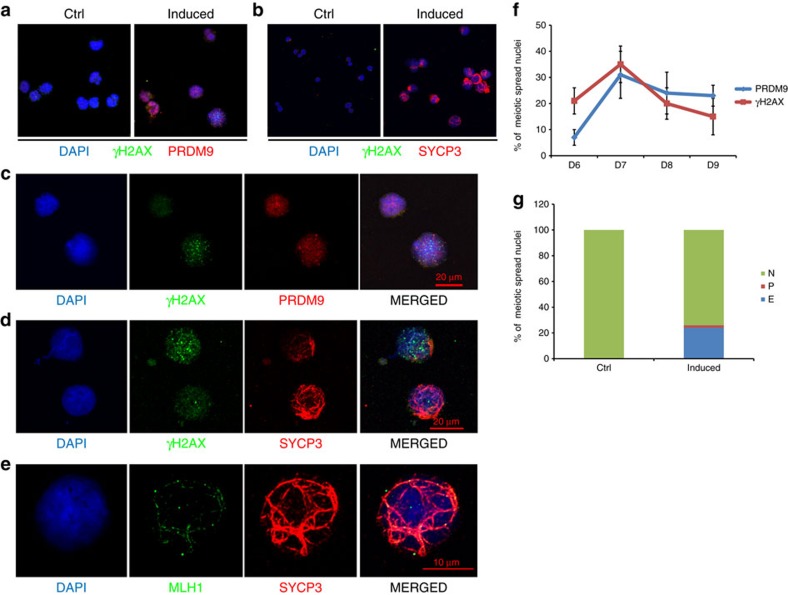
Figure 4. Meiotic progressions in the differentiated hESCs.
(a) Representative images of meiotic spreads and immunofluorescent staining of PRDM9 and γH2AX in control and induced hESCs. (b) Representative images of meiotic spreads and immunofluorescent staining of SYCP3 and γH2AX in control and induced hESCs. (c) Magnified image of the meiotic spreads and the immunofluorescent staining of PRDM9 and γH2AX in induced hESCs. Bar, 20 μm. (d) Magnified image of the meiotic spreads and immunofluorescent staining of SYCP3 and γH2AX in induced hESCs. Bar, 20 μm. (e) Magnified image of the meiotic spreads and immunofluorescent staining of SYCP3 and MLH1 in induced hESCs. Bar, 10 μm. (f) Percentages of PRDM9- and γH2AX-positive nuclei during in vitro-induced meiosis from day 6 to day 9, n>200 meiotic nuclei at each time point, error bar indicates s.d. (g) Percentages of nuclei with no SYCP3 (N), punctate SYCP3 (P) or elongated SYCP3 (E) during in vitro-induced meiosis at day 7, n>200 meiotic nuclei. At least three independent experiments were conducted for each set of meiotic spreads and immunostainings described above.

