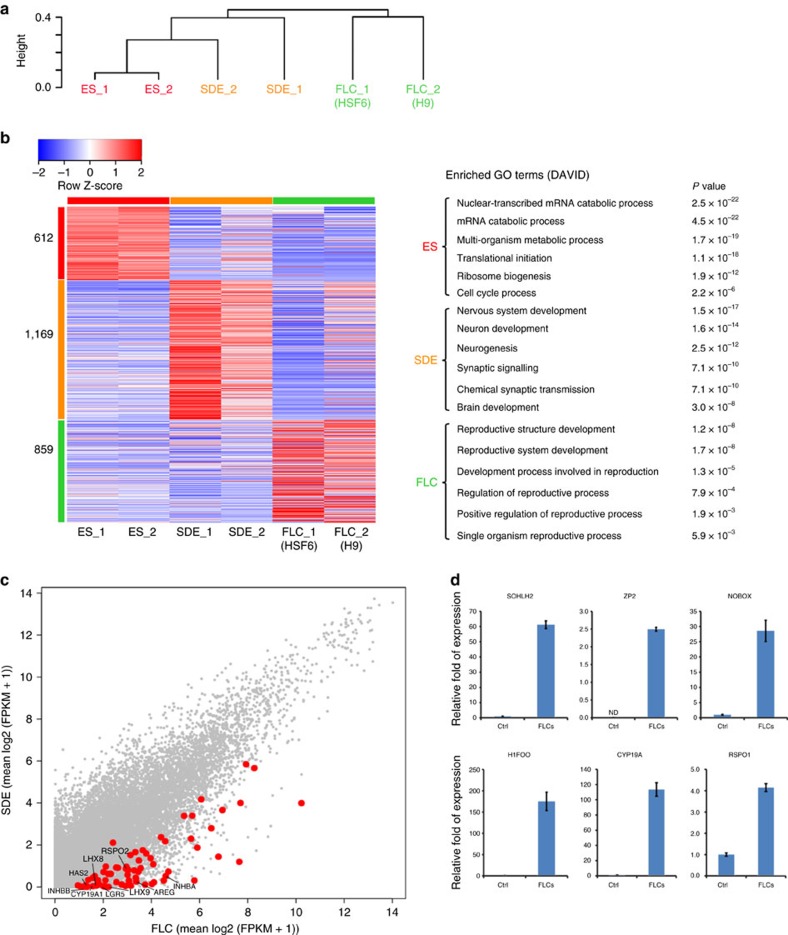
Figure 6. Transcriptional profiles of FLCs by whole-genome RNA sequencing and qPCR.
(a) Unsupervised hierarchical clustering of gene expression in hESC (ES), spontaneously differentiated hESCs (SDE) and FLCs (one sample from H9 and one from HSF6). Independent biological duplicates of each group were subjected to whole-genome RNA sequencing. (b) Heat map of gene expression of ES, SDE and FLC shows different expression of genes in these three groups. Left, heat map; right, gene ontology (GO) of 612, 1169 and 859 differentially expressed genes. (c) Scatter plot analysis of transcripts between SDE and FLC. Red dots show genes enriched in reproductive tissues (oocytes or granulosa cells) that are highly expressed in FLC. (d) mRNA expression of SOHLH2, ZP2, NOBOX, H1FOO, CYP19A and RSPO1 was evaluated by an independent experiment collecting 30 FLCs compared with the same number of cells from control cultures. n=3 (technical replicates of 30 independent FLCs collected and pooled together), error bar indicates SD, >3 independent experiments.

