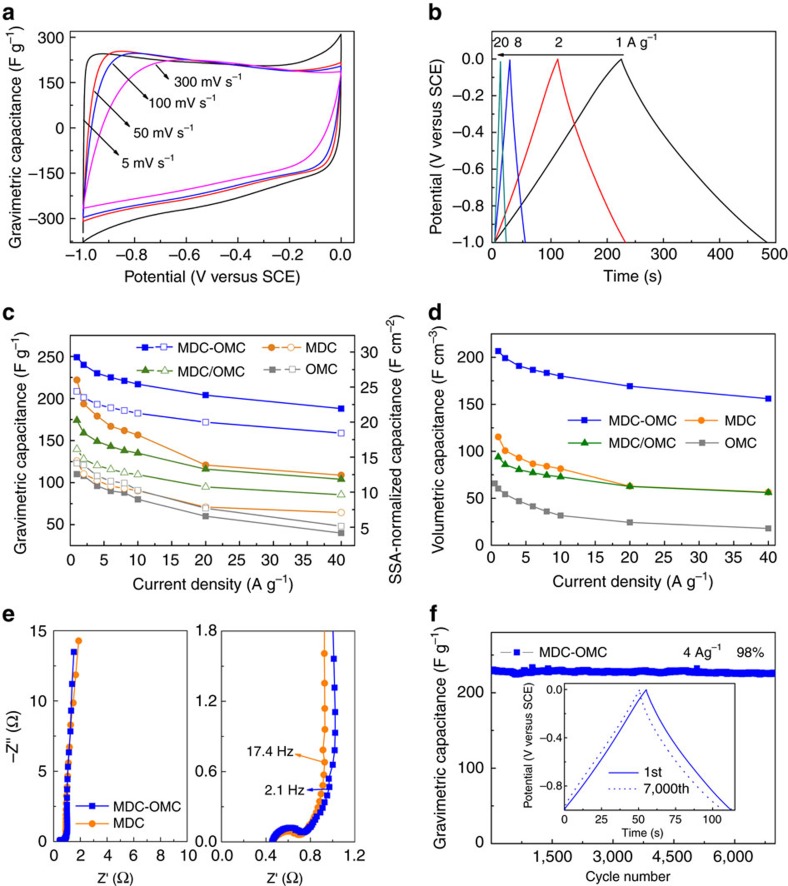
Figure 5. Electrochemical performance of MDC-OMC.
(a) CV curves of the MDC-OMC at various scan rates. (b) GCD curves of the MDC-OMC at different current densities. (c) Comparison of gravimetric capacitances (the solid symbols) and SSA-normalized capacitances (the hollow symbols) and (d) volumetric capacitances versus different current densities for the MDC-OMC, MDC/OMC, MDC and OMC. (e) Nyquist plots of the MDC-OMC and MDC with the close-up view on the high-frequency regime. (f) Cycling performance of the MDC-OMC. Inset: The corresponding galvanostatic charge/discharge curves at a current density of 4 A g−1 of 1st and 7,000th cycle. The reference electrode is a SCE.

