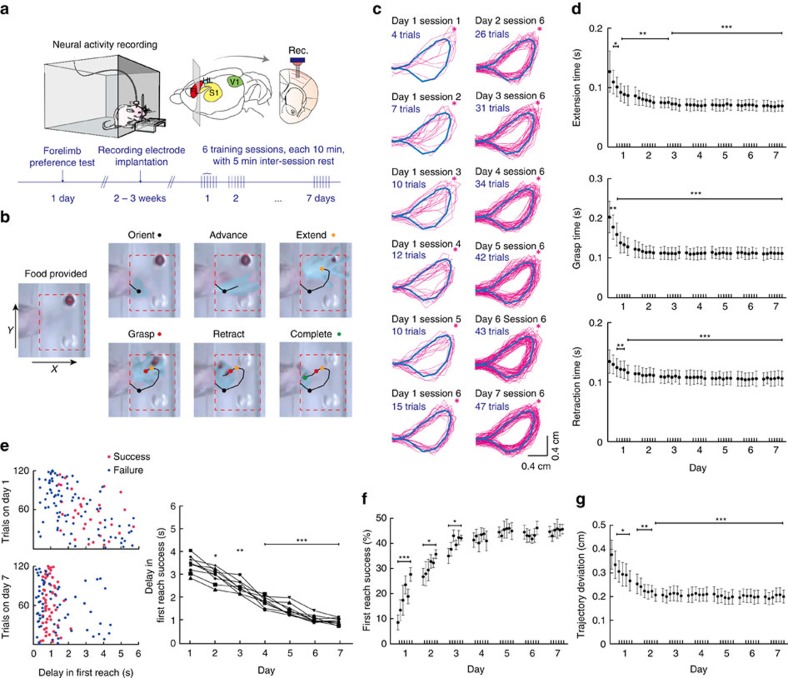
Figure 1. Forelimb reaching for food training and simultaneous recording from L5b neurons in M1.
(a) Schematics of experimental paradigm. Neural activities in L5b were recorded during forelimb food-reaching task training over 7 days by multi-channel recording electrode array (Rec.). FL and HL: forelimb and hindlimb territories of M1; S1: primary somatosensory cortex; V1: primary visual cortex. (b) Six phases of a first reach success trial captured by camera and the forelimb trajectory tracked automatically (see Methods). (c) The evolution of more uniform forelimb trajectories (pink) in first reach success trials. The reference expert trajectory is shown in blue colour. Red asterisk denotes the position of food pellet. (d) The duration of forelimb extension (upper panel), grasping (middle panel) and retraction (lower panel) in first reach success trials. The timing of reaching action shortened significantly in day 1 and exhibited further decrease in day 2 and 3, and remained steady thereafter. Mean±s.d. *P<0.05; **P<0.01; ***P<0.001, one-way repeated measures ANOVA, n=9. (e) Left, delay in first reach attempt quantified by the time interval between food provision and the ‘orient' position of forelimb on days 1 and 7 (120 consecutive trials each from a single representative rat). Right, learning associated shortening in the delay in first reach success attempt. Mean±s.d. of delay in first reach success trials: day 1: 3.44±0.37 s; day 7: 0.96±0.14 s, P=2.51 × 10⁻⁶; *P<0.05; **P<0.01; ***P<0.001, all compared with day 1; one-way ANOVA, 9 rats; first reach failure trials: day 1: 2.31±1.55 s; day 7: 1.45±1.20 s, P=0.012; one-way ANOVA, 9 rats. (f) Training-dependent improvement in first reach success rate (see text). (g) Evaluation of forelimb trajectory spatial variance as the averaged distance integrated over time between the actual trajectories in first reach success trials (pink) and the reference expert trajectory (blue) shown in d. Mean cumulative Euclidean distance±s.d., day 1 session 1: 0.375±0.061 cm; day 1 session 6: 0.265±0.042 cm, P=0.0173; day 2 session 1: 0.252±0.041 cm, P=0.0052; day 2 session 6: 0.205±0.026 cm, P=7.85 × 10⁻⁴; *P<0.05; **P<0.01; ***P<0.001, all compared to day 1 session 1, one-way repeated measures ANOVA, n=9.

