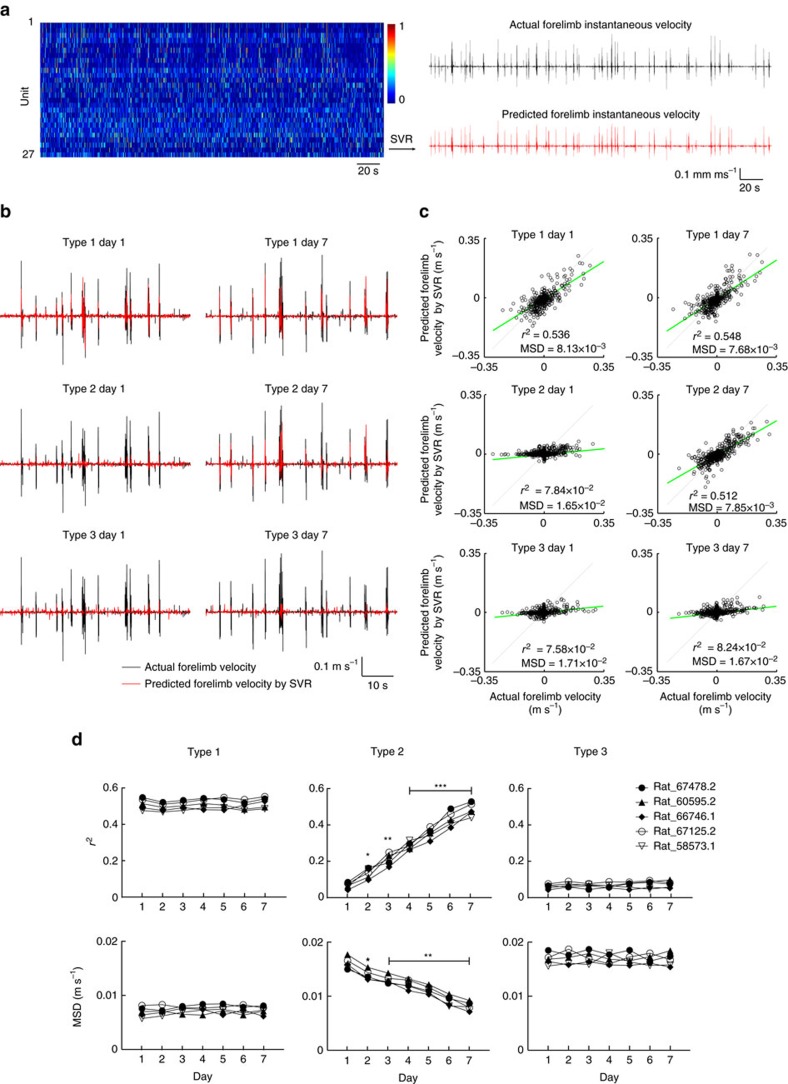
Figure 4. Learning-dependent changes of population prediction accuracy for forelimb instantaneous velocity.
(a) SVR decoding of forelimb velocity from neural population activities. For each neuron, the firing histogram (bin size: 12.5 ms, left) was aligned to the behavioural event (27 units from an example animal), and the values was linearly normalized to 0–1 range. The actual forelimb instantaneous velocity (top right) was predicted using SVR by the corresponding population spike events. (b) Representative traces of actual forelimb instantaneous velocity (black) and the SVR model predicted forelimb velocity (red) by three types of neurons classified (type 1 neuron: n=4; type 2 neuron: n=12; type 3 neuron: n=11, from an example animal), illustrating the changes in population decoding accuracy during early (day 1) and late (day 7) training sessions. (c) Least squares regression analyses between actual forelimb instantaneous velocity and the SVR model predicted forelimb velocity based on three types of L5b PNs shown in a during early and late training sessions. The Pearson's correlation coefficient (r2) and mean squared deviation (MSD) for each regression are shown. Each data point represents the instantaneous velocity of the forelimb trajectory predicted from neural population activity versus the actual velocity of displacement calculated from high-speed camera recording (in 12.5 ms bins). (d) Summarized result of r2 and MSD of predicted and actual forelimb instantaneous velocity by three types of PNs (n=131) recorded from five rats. Upper left panel, day 1: r2=0.513±0.013, day 3: r2=0.505±0.010, P=0.098; day 7: r2=0.520±0.013, P=0.492; bottom left panel, day 1: MSD=0.0069±0.00043, day 3: MSD=0.0073±0.00028, P=0.370; day 7: MSD=0.0072±0.00033, P=0.448. Top middle panel, day 1: r2=0.067±0.007, day 3: r2=0.211±0.014, P=0.006; day 7: r2=0.483±0.016, P=1.23 × 10⁻⁴; Bottom middle panel, day 1: MSD=0.0161±0.00048, day 3: SD=0.0130±0.00034, P=0.008; day 7: MSD=0.0081±0.00035, P=0.002. Top right panel, day 1: r2=0.061±0.006, day 3: r2=0.066±0.015, P=0.587; day 7: r2=0.073±0.008, P=0.312. Bottom right panel, day 1: MSD=0.0169±0.00047, day 3: MSD=0.0171±0.00051, P=0.282; day 7: MSD=0.0167±0.00055, P=0.781, all compared to day 1, one-way repeated measures ANOVA, n=5.

