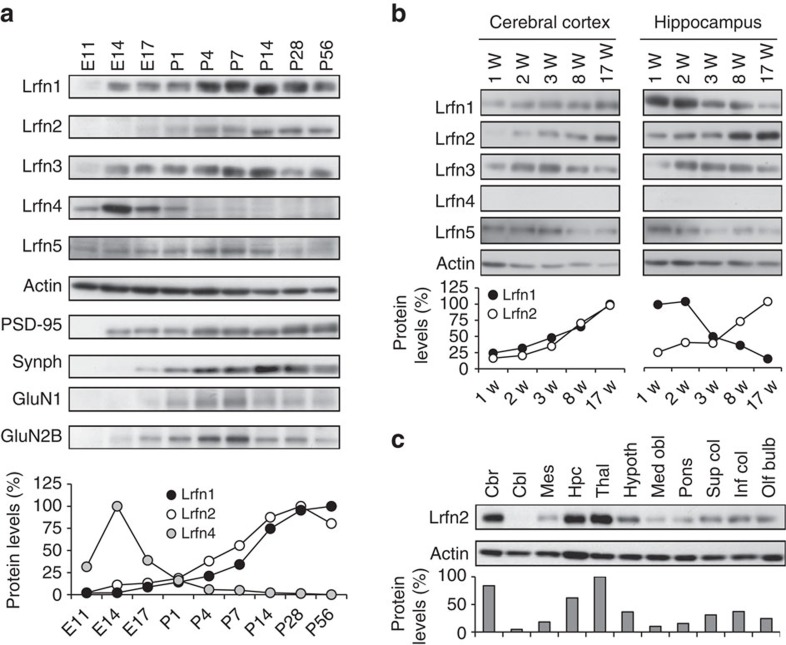
Figure 1. Expression profiles of Lrfn proteins and characterization of Lrfn2 in the mouse brain.
(a) Developmental expression patterns in mouse brain. Mouse brain extracts (10 μg of protein per lane) at the indicated ages (E, embryonic day; P, postnatal day) were analysed by immunoblotting with the indicated antibodies. Actin was monitored as a loading control. Synph represents synaptophysin. (b) Expression profiles of Lrfn proteins in the cerebral cortex and hippocampus during mouse postnatal development (W, postnatal week). Mouse tissue homogenates (5 μg of protein per lane) were analysed by immunoblotting. Actin was monitored as a loading control. Lrfn4 was not detected in the conditions we used. (a,b) Graphs indicate actin-normalized protein levels of PSD-95-binding Lrfn proteins, based on densitometric quantification of the indicated images. Maximal expression levels are adjusted to 100%. (c) Tissue distribution of Lrfn2 protein in 8-week-old mouse brain (10 μg of protein per lane). Graph indicates actin-normalized Lrfn2 protein level. Maximal expression level is adjusted to 100%. (a–c) Similar results were obtained in 2–6 independent blots except synaptophysin, GluN1, and GluN2B.

