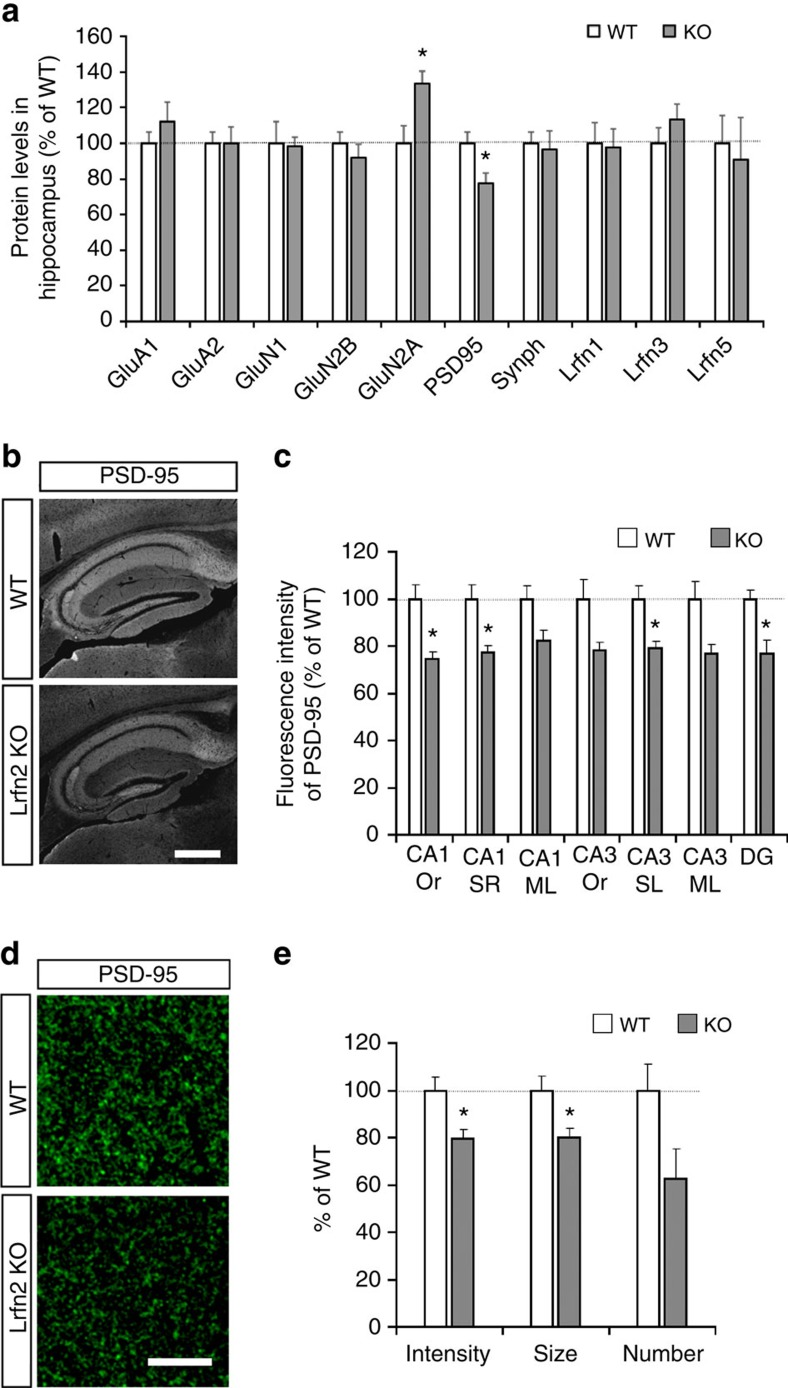
Figure 4. Quantification of synaptic proteins in Lrfn2 KO mice.
(a) Expression levels of synaptic proteins in the S1 fraction from adult hippocampus. The protein levels were densitometrically measured after immunoblotting (WT, n=8; KO, n=9 from three independent experiments; *P<0.05, t-test). (b) Immunostaining of hippocampus using an anti–PSD-95 antibody. Scale bar, 500 μm. (c) Quantification of fluorescence signal intensities in CA1, CA3 and dentate gyrus (DG) (n=3 mice, means of two images for each mice; *P<0.05, t-test). Or, oriens layer; SR, radial layer; ML, lacunosum molecular layer; SL, stratum lucidum layer. (d) Immunostaining for PSD-95 in the CA1 radial layer. Confocal images at a higher magnification than the images shown in b. Scale bar, 20 μm. (e) Quantification of intensity, size and number of PSD-95 puncta (n=6 sections from three mice per genotype; *P<0.05, t-test).

