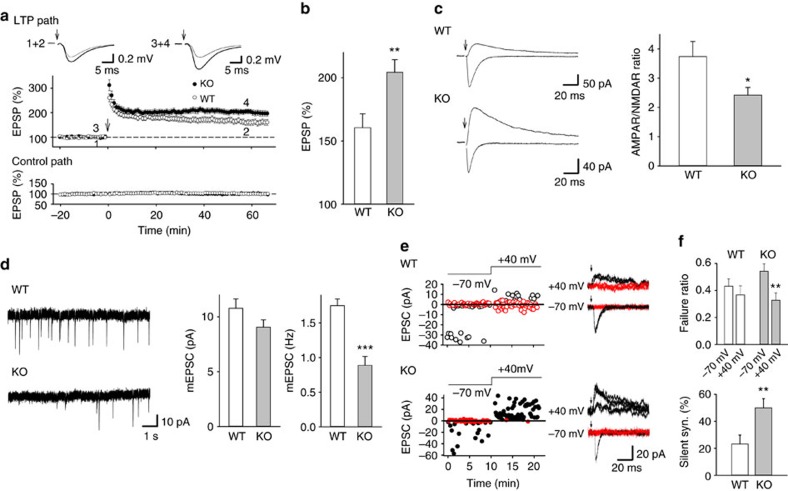
Figure 6. Regulation of LTP and the expression of synaptic AMPAR by Lrfn2.
(a–c) Enhanced LTP and reduction of the AMPAR/NMDAR ratio in the hippocampus Shaffer collateral–CA1 synapses of Lrfn2 KO mice. (a) LTP in the hippocampus. (upper) Representative averaged traces taken at the times indicated by numbers in the lower panel, and (lower) summary of time course of fEPSP slopes in LTP and control pathways. WT (open circles), n=15 slices from six mice; Lrfn2 KO (filled circles), n=17 slices from seven mice. (b) Summary of LTP. LTP in Lrfn2 KO mice was significantly enhanced (**P<0.01, t-test). (c) Summary of AMPAR/NMDAR ratios (WT, n=14 cells, 14 slices from four mice; Lrfn2 KO, n=13 cells, 13 slices from five mice; *P<0.05, t-test). (d) Summary of mEPSC amplitude and frequency in WT (n=7 cell, seven slices from two mice) and KO mice (n=7 cell, seven slices from two mice) (***P<0.001). (e) Examples of AMPAR-EPSCs and NMDAR-EPSCs evoked by minimal stimulation in WT and KO mice. Red circles and traces indicate failed responses. (f) Summary of failure rates (upper) and per cent of silent synapses (lower) in WT (n=13 cells, 13 slices from three mice) and KO mice (n=21 cells, 21 slices from four mice) (**P<0.01). The recording was carried out using one mouse in a day. Mice in the same experimental group showed similar results.

