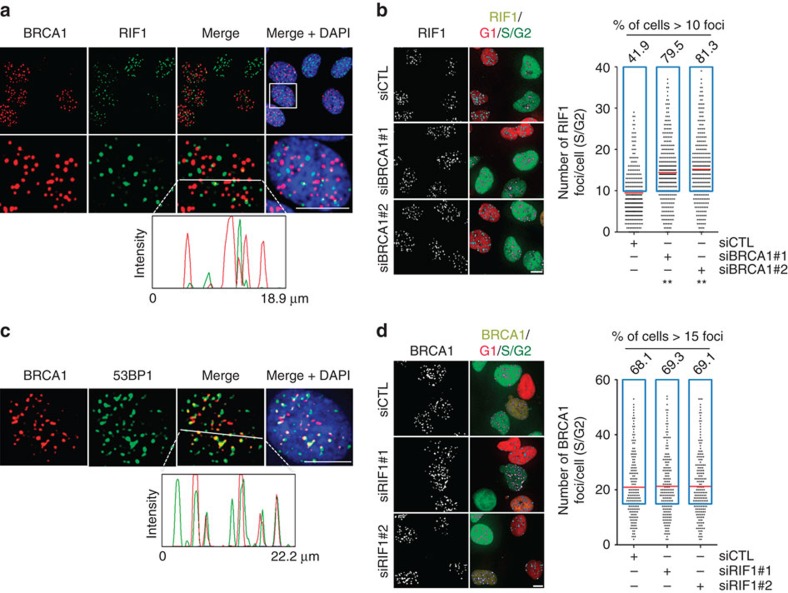
Figure 1. RIF1 and BRCA1 IRIF co-exist in S/G2 cells.
(a) Co-staining of BRCA1 and RIF1 in U2OS cells 1 h after 2 Gy IR. (b) Quantification of RIF1 focus number per cell in U2OS-Fucci cells transfected with control or two different BRCA1 siRNAs. The cells were subjected to 2 Gy IR 3 days after the siRNA transfection. Left panel: representative images of RIF1 foci. Right panel: quantification of RIF1 focus number in the cells (n>212). (c) Co-staining of BRCA1 and 53BP1 in U2OS cells 1 h after 2 Gy IR. (d) Quantification of BRCA1 focus per cell in U2OS-Fucci cells transfected with control or two different RIF1 siRNAs. Cells were subjected to 2 Gy IR 3 days after the siRNA transfection. Left panel: representative images of BRCA1 foci. Right panel: quantification of BRCA1 focus number in the cells (n>188). The intensity profile graphs show the immunofluorescence intensities of the indicated proteins along the line on the images (a,c). Red lines on the graphs indicate the mean number of RIF1 (b) or BRCA1 (d) foci per cell. Blue boxes designate cells with more than 10 RIF1 foci (b) or 15 BRCA1 foci (d). The percentages of RIF1-positive (>10 foci) or BRCA1-positive (>15 foci) cells are indicated above each blue box. ** (in b) indicates P<0.001 (student’s t-test). Scale bars represent 10 μm.

