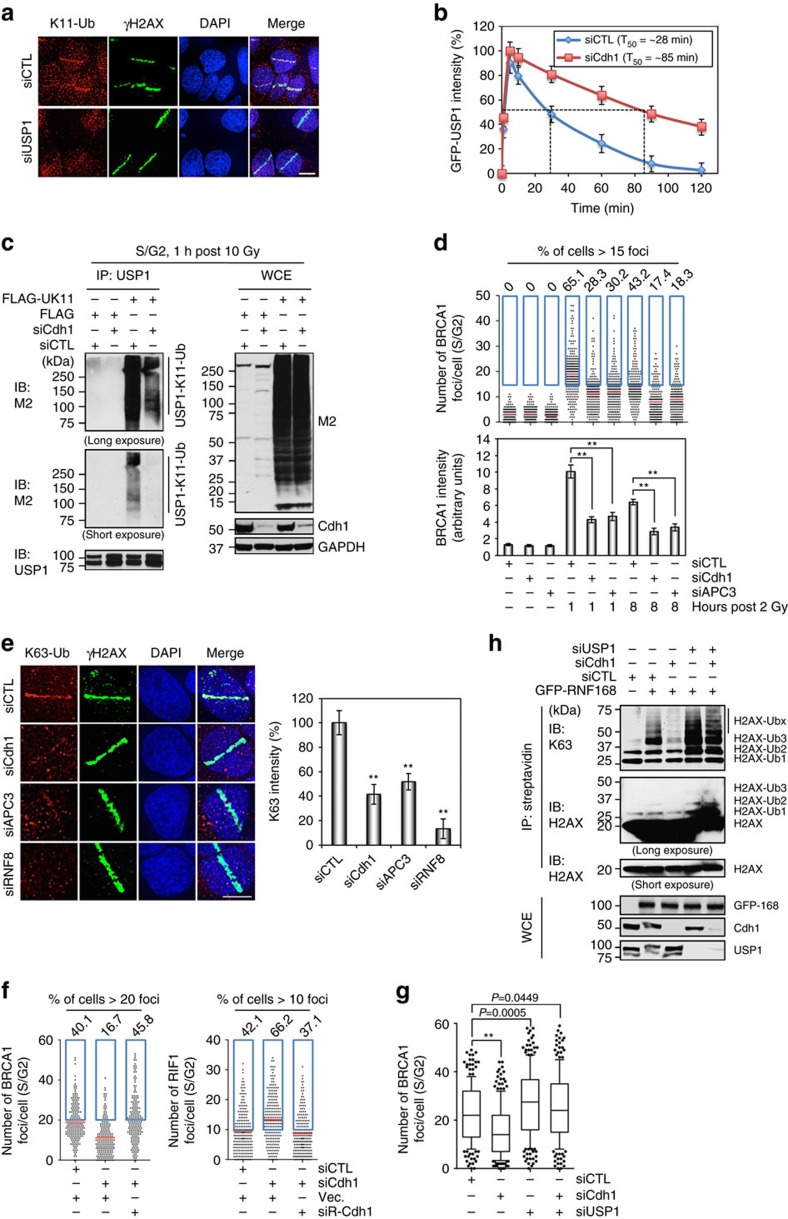
Figure 4. USP1 is targeted by APCCdh1 at DSBs.
(a) The K11-linked ubiquitin chains were primarily formed on USP1. U2OS cells transfected with control or USP1 siRNA were microirradiated and processed for immunostaining 30 min later. (b) The mobilization kinetics of GFP-USP1 to sites of DNA damage. GFP-USP1 was expressed in U2OS cells transfected with the indicated siRNAs and its mobilization was monitored for 2 h following the microirradiation. (c) In vivo ubiquitination assay of endogenous USP1 in the presence or absence of Cdh1 after DNA damage. Cell lysates were prepared as described in methods. (d) Quantification of BRCA1 focus number and intensity in Cdh1- and APC3-depleted cells. The cells were subjected to 2 Gy IR 3 days after the siRNA transfection. Top panel: quantification of BRCA1 foci per cell. Blue box designates the cells with more than 15 foci, whose percentage is indicated above each box. Bottom panel: average intensities of BRCA1 focus per cell (n>195). (e) The accumulation of endogenous K63-linked ubiquitin chains at damage sites. U2OS cells were microirradiated and recovered for 30 min before the immunofluorescence analysis of K63-linked Ub and γH2AX. Left panel: representative images of K63-linked Ub and γH2AX. Right panel: quantification of K63-linked Ub at microirradiated regions (n>102). (f) Quantification of BRCA1 (n>191) and RIF1 (n>197) focus formation in U2OS-Fucci cells transfected with the indicated siRNAs and siCdh1-resistant Cdh1 constructs. Blue box designates the cells with more than 20 (BRCA1 positive) and 10 (RIF1 positive) foci, respectively. The percentages of BRCA1-positive and RIF1-positive cells are indicated above each box. (g) Quantification of BRCA1 focus number in the cells transfected with the indicated siRNAs (n>200). (h) In vivo ubiquitination of H2AX in Cdh1-, USP1- or both Cdh1- and USP1-depleted cells. The indicated siRNAs were transfected first, followed by GFP-RNF168 transfection 48 h later, and another 24 h later, the cells were irradiated with 10 Gy and harvested 1 h after IR for the analysis of H2AX ubiquitination. Error bars indicate SEM from three independent experiments. ** indicates P<0.001 (student’s t-test). Scale bars represent 10 μm.

