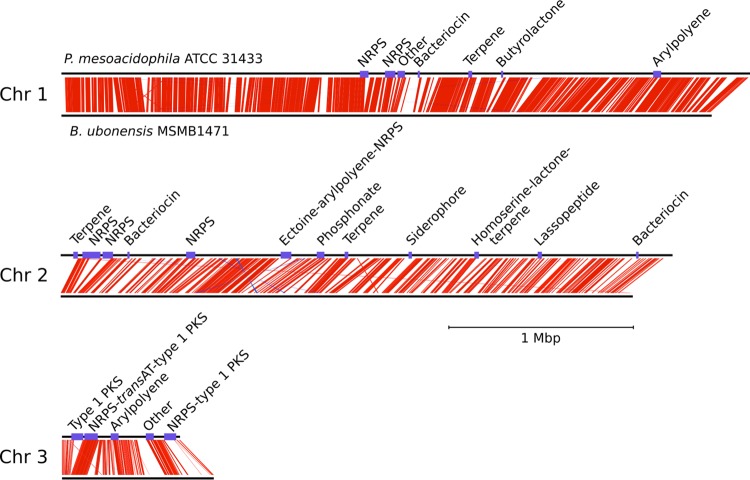
FIG 2.
Genome sequence comparison of P. mesoacidophila ATCC 31433 and B. ubonensis MSMB1471. Each chromosome (Chr) is displayed separately and to scale (as indicated), with P. mesoacidophila ATCC 31433 above and B. ubonensis MSMB1471 below. Regions of homologous sequences are linked with red lines. AntiSMASH-predicted gene clusters are shown in purple. The smallest contig of the P. mesoacidophila ATCC 31433 genome is not shown, because it neither had homology with B. ubonensis MSMB1471 nor contained any antiSMASH-predicted biosynthetic pathways.

