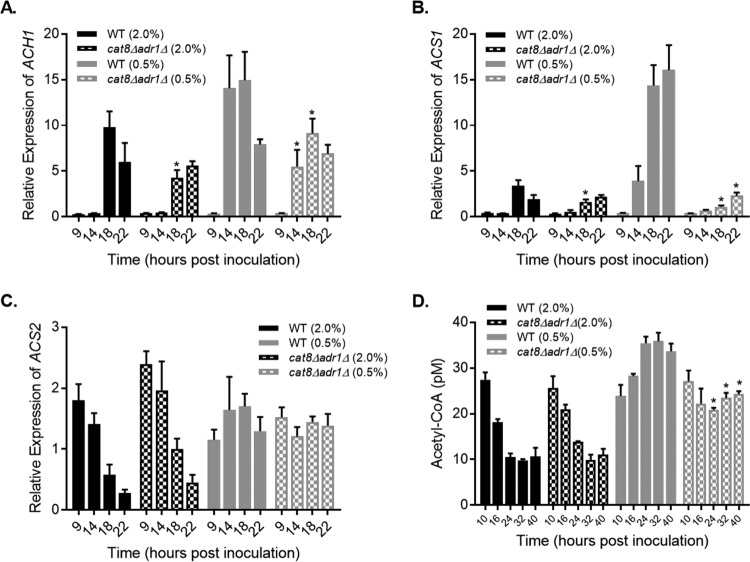
FIG 6.
Effects of CR on acetyl-CoA and expression of genes involved in acetyl-CoA production. (A) Quantitative RT-PCR of ACH1 expression relative to control during a time course with WT (BY4741) and cat8Δ adr1Δ (JS767) strains. Strains were inoculated into NR (2% glucose) or CR (0.5% glucose) cultures. (B and C) Quantitative RT-PCR of ACS1 expression (B) and ACS2 expression (C) across the same time course. (D) Quantitation of acetyl-CoA from whole-cell extracts of BY4741 and JS767 derived from a time course of NR and CR cultures from log phase (10 h) to stationary phase (40 h). Asterisks indicate a significant difference between the WT and mutant strains for each time point (P < 0.01).

