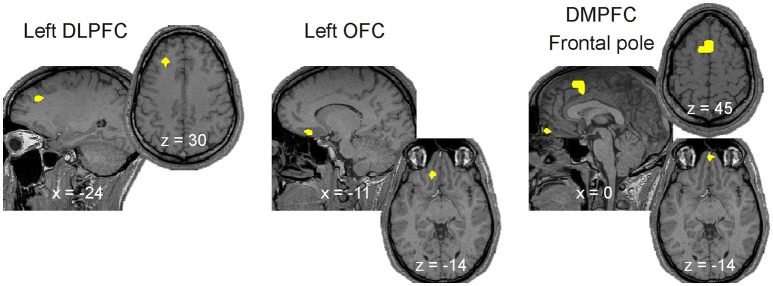
Figure 10.
Brain activations strongly associated with the emergence of spindles and KCs, i.e., satisfying the three criteria for increases leading from awake state to spindles and KCs (see Section Continuity of Common Regional Spectral Power Changes Leading to Spindles and KCs). The four brain areas with continuous increases in activity (yellow) across key periods of sleep leading to the emergence of KCs and/or spindles in all subjects. For each case a pair of orthogonal MRI slices (sagittal and axial) is displayed. Common activity in the left DLPFC and left OFC are superimposed on left and middle pairs of MRI cuts, respectively. The activity in the DMPFC and Frontal pole regions are superimposed on the pair of MRI cuts on the right; DMPFC/Frontal pole activity is more superior/inferior on the sagittal slice and is shown on the upper/lower axial slice. The x and z coordinates of the MRI slices in the Talairach space are provided at the bottom of sagittal and axial slices, respectively. More details for each of the four ROIs can be found (a) all three Talairach coordinates in Table 1, (b) specific spectral power change in each POI and its statistical significance in Figures 4–9.

