
Figure 11.
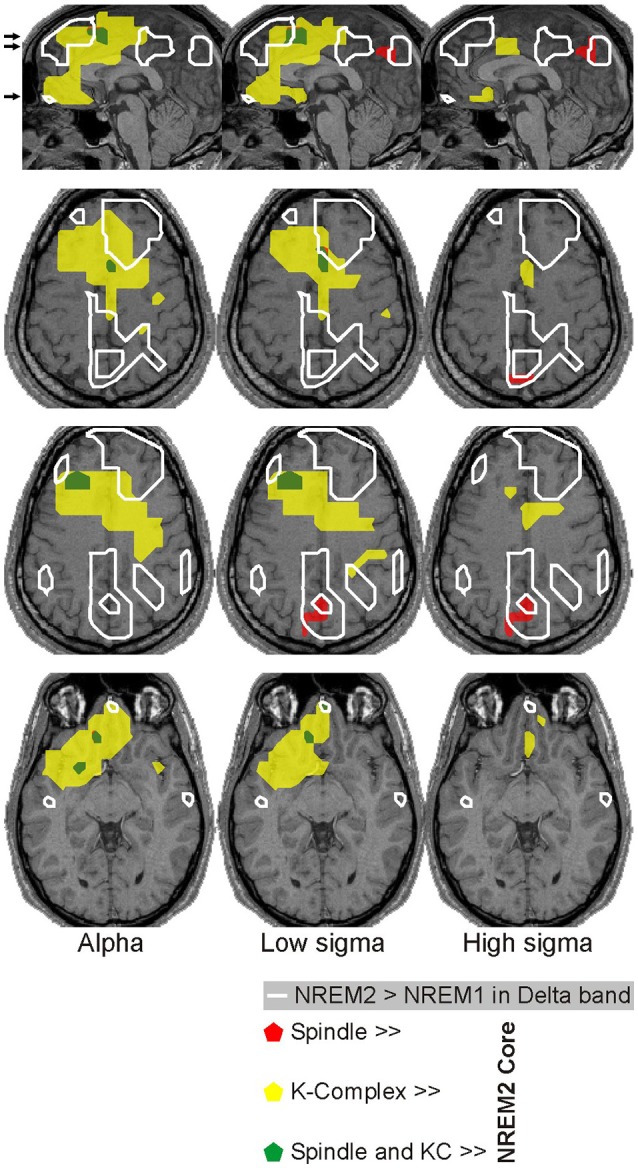
Spatial organization of spindle- and KC-related areas common across all 4 subjects. Prominent (p < 0.00001), increases of brain activity during spindles (red) and KCs (yellow) over NREM2 activity during core periods are shown on the midline sagittal slice and three axial slices. The positions of the axial slices are indicated by black arrows on the sagittal slice. The areas with prominent increases in activity during both spindles and KCs are shown in green. White contours encompass regions with modest (p < 0.05) increases in delta band activity in NREM2 over NREM1 activity during core periods (“NREM2 low frequency areas”). The same symbols as in Figure 5 are used to indicate modest and prominent changes in spectral power.