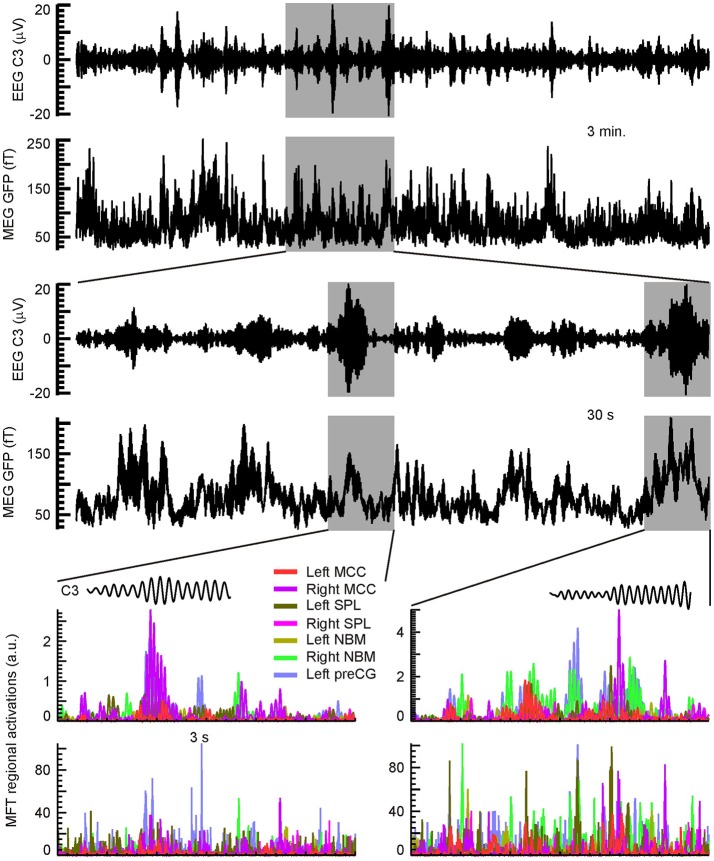
Figure 12.
Typical example of a hierarchy of time courses involving spindles. The top pair of rows shows the EEG (C3) and MEG (GFP) during a 3 min run; the EEG and raw MEG signals were both filtered in the sigma band (11–17 Hz). The next two rows show the same signals for the 30 s shaded segment, where five spindles can be identified. The last two rows show the RACs of 7 ROIs, during the two most prominent spindles in the 30-s segment (shaded for highlight in the middle pair of rows). See Table 1 for details on ROIs. RACs were squared to emphasize the temporal locations and sequence of the peaks. The RACs presented in the penultimate row were filtered in the sigma band before squaring. The insets just above the RAC plots show the concurrently recorded EEG (C3) spindles (11–17 Hz). Note the difference of nearly two orders of magnitude between the filtered (penultimate row) and wideband (last row) RACs.

