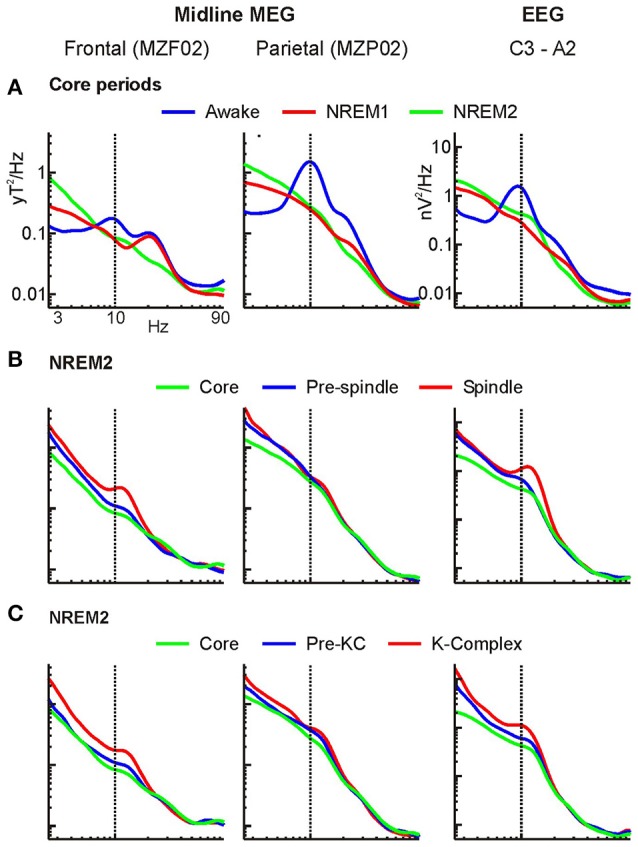
Figure 3.

Grand average MEG and EEG power spectra. Spectra for a frontal and parietal midline MEG channels and an EEG channel. Logarithmic scale is used on both the frequency and power axes (log-log plot). (A) Comparison of core periods. (B,C) Comparison of NREM2 core period with periods immediately before and during (B) spindles and (C) KCs. The NREM2 core period spectra (green curves) are shown in all figures. For ease of comparisons the same frequency axis (abscissa) is used in all 9 plots, and the same power axis (ordinate) is used in all MEG (first two columns) plots and in all EEG (third column) plots.
