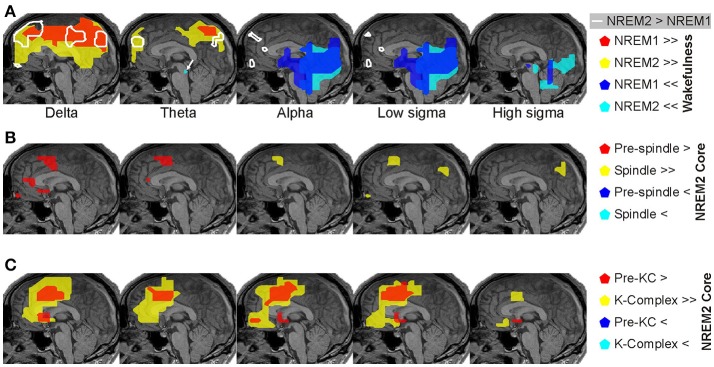
Figure 5.
Spectral power changes close to the midline saggittal slice across the periods of interest (POI). Spectral power changes common across all subjects are shown. (A) Prominent (p < 0.00001), increases (red and yellow) and decreases (blue and cyan) of brain activity in NREM1 (red and blue) and NREM2 (yellow and cyan) core periods from the awake resting state baseline are shown on a midline sagittal MRI slice. White contours encompass regions with modest (p < 0.05) increases in activity obtained from direct comparison of NREM2 with NREM1 core periods (NREM2 > NREM1). (B) Significant increases of brain activity immediately before (p < 0.05; red) and during (p < 0.00001; yellow) spindles. At a lower significance threshold of p < 0.05, a wider set of areas was identified during spindles in the cortex and upper brainstem and thalamus (Figures 6, 7). (C) Significant increases of brain activity immediately before (p < 0.05; red) and during (p < 0.00001; yellow) KCs. Note that neither for spindles nor for KCs we find any reduction in spectral power relative the NREM2 core period. The statistically significant activations at the thresholds of p < 0.00001 and p < 0.05 are referred to as “prominent” and “modest” in the manuscript and indicated by the symbols >>/<< and >/< in figures, respectively. For details away from the midline see Figures 6–9.

