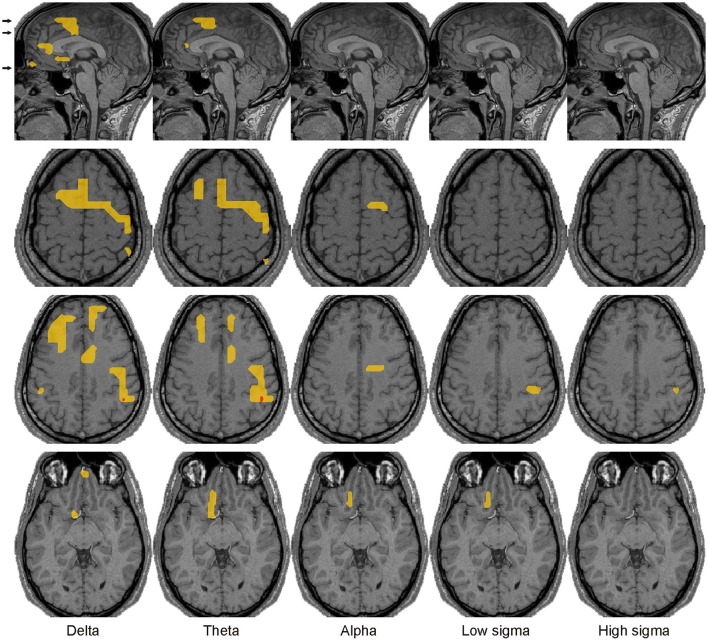
Figure 6.
Spectral power changes before spindles. Common across all subjects increases of brain activity before spindles over NREM2 core periods at the significance thresholds of p < 0.00001 (red) and p < 0.05 (yellow) are shown on the midline sagittal slice and three axial slices. The positions of the axial slices are indicated by black arrows on the sagittal view. The last row shows that the middle part of the elongated left OFC area, lying within or close to the NBM, is the only basal forebrain area that maintains the increase in spectral power in the POI before spindles relative to NREM2 core in the alpha and low sigma bands.

