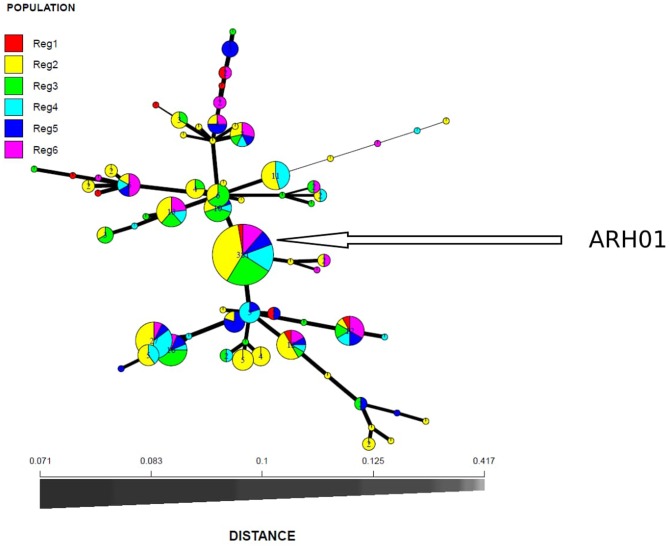
FIGURE 3.
Minimum spanning network based on Bruvo genetic distances representing 66 MLGs observed in six A. rabiei populations from Australia. Node colors represent population membership proportional to the pie size. Node sizes are relatively scaled to logl.75n, where n is the number of samples in the nodes to reduce node overlap. Edge thickness (lines) represent minimum genetic distance between haplotype.

