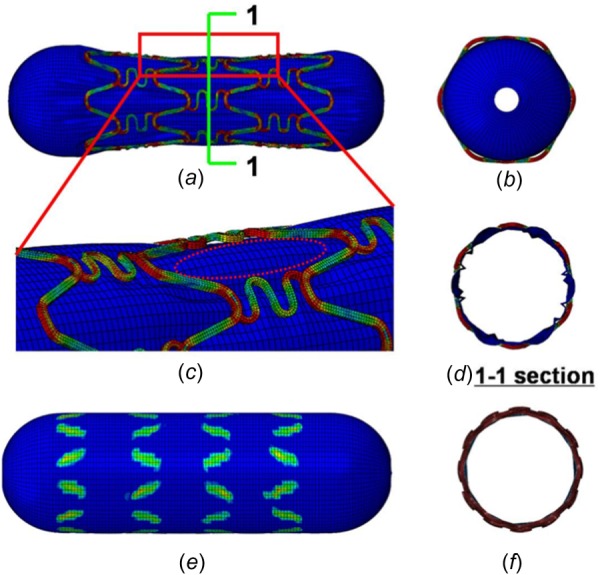
Fig. 11.

Diagrams of the “dog bone” effect and “local dog bone” effect. (a) The “dog bone” effect during stent expansion, (b) the “dog bone” effect as viewed along the axial direction, (c) the “local dog bone” effect during stent expansion, (d) the “local dog bone” effect from 1 to 1 section view, (e) the contact pressure distribution after the load has been released, and (f) the nonuniform deformation of the overlapping stent as viewed from the axial direction.
