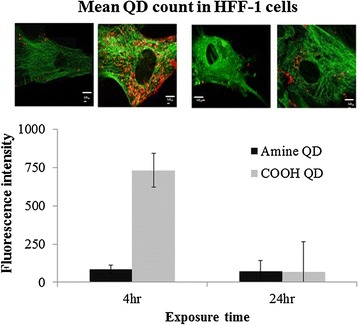
Fig. 1.

Graph representing semi-quantitative results of fluorescence intensity of QDs detected in HFF-1 cells following 4 and 24 h exposure. Data are expressed as mean ± standard error of the mean (SEM, n = 10). The inserts are representative confocal microscopy images of tubulin (green) stained cells exposed to the respective QDs (red) at 7.5 nM QD concentration. Scale bars correspond to 10 μm
