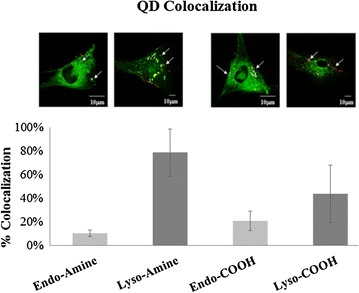
Fig. 2.

Graph representing results of colocalization analysis using the JACoP plugin from ImageJ using Manders’ correlation coefficient. The thresholded Mander’s M values corresponding to the fraction of QDs in the lysosomes (“Lyso”) or endosomes (“Endo”) following 24 h exposure are shown. Results are presented as the mean ± SEM (n = 10). Representative confocal images of colocalized (white points) QDs with endosomes or lysosomes are presented above each bar. Examples of colocalized points are indicated with white arrows. Scale bars correspond to 10 μm
