Fig. 5.

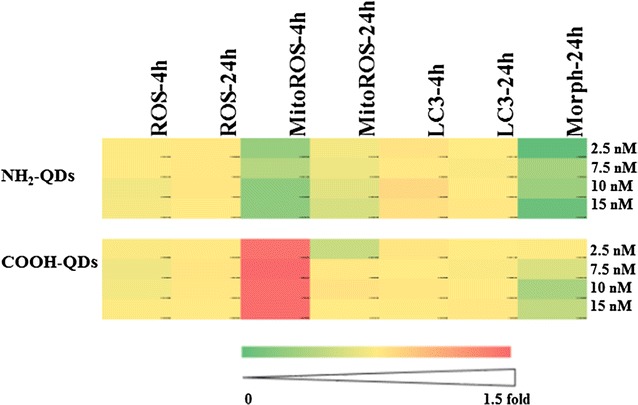
A heat map of the level of toxicity detected with the different toxicity screening assays upon exposure of the cells to the NH2-QDs or COOH-QDs at 2.5, 7.5, 10, and 15 nM concentrations

A heat map of the level of toxicity detected with the different toxicity screening assays upon exposure of the cells to the NH2-QDs or COOH-QDs at 2.5, 7.5, 10, and 15 nM concentrations