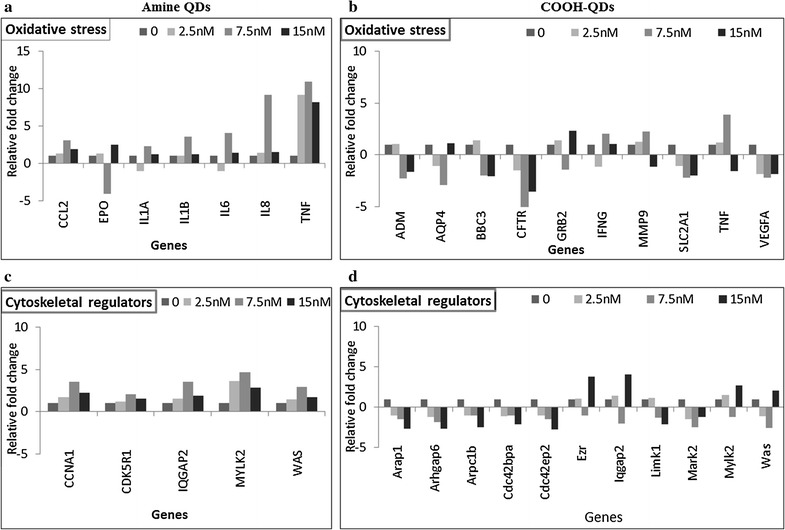
Fig. 6.

Graphs showing relative gene expression changes in HFF-1 cells exposed to either COOH- or NH2-QDs at 0, 2.5, 7.5 or 15 nM concentrations for 24 h. Concentrations were selected where no significant toxicity were detected, along with the negative control. All genes tested are genes involved in the human oxidative stress pathway (a, b) and the human cytoskeletal regulator gene pathway (c, d). Only those genes are shown in which for at least one of the tested concentrations a more than twofold change was detected. Data are expressed as the fold-change in mean gene expression values, normalized to the values obtained in untreated control cells
