
Fig. 5.
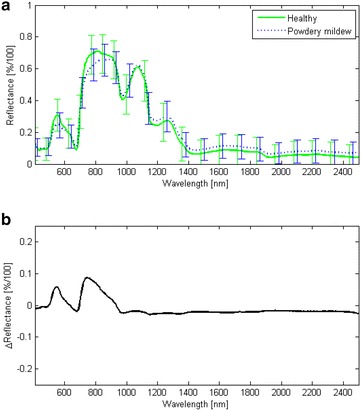
Illustration of reflectance spectra. Spectral signatures of healthy detached berries and detached berries with severe powdery mildew infection (a) and the differences between mean spectra of healthy and diseased berries (b). The standard deviations of the spectral signatures are shown as error bars in a. Spectrally localized differences are observed in the green peak region (550 nm) of the spectra and just above the red edge region (680–730 nm). Throughout the shortwave infrared region a shift between the mean spectral signatures occurs due to higher reflectance of the diseased berries