
Fig. 2.
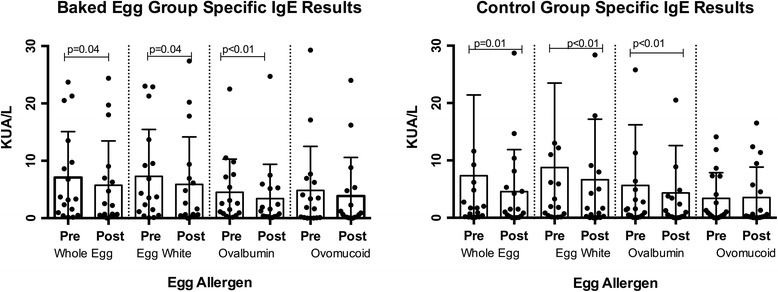
Changes in egg specific IgE from baseline to end of intervention. Changes in egg allergen specific IgE levels from the beginning to end of the intervention. Box and bars indicate the median and IQR
Official websites use .gov
A
.gov website belongs to an official
government organization in the United States.
Secure .gov websites use HTTPS
A lock (
) or https:// means you've safely
connected to the .gov website. Share sensitive
information only on official, secure websites.
Changes in egg specific IgE from baseline to end of intervention. Changes in egg allergen specific IgE levels from the beginning to end of the intervention. Box and bars indicate the median and IQR