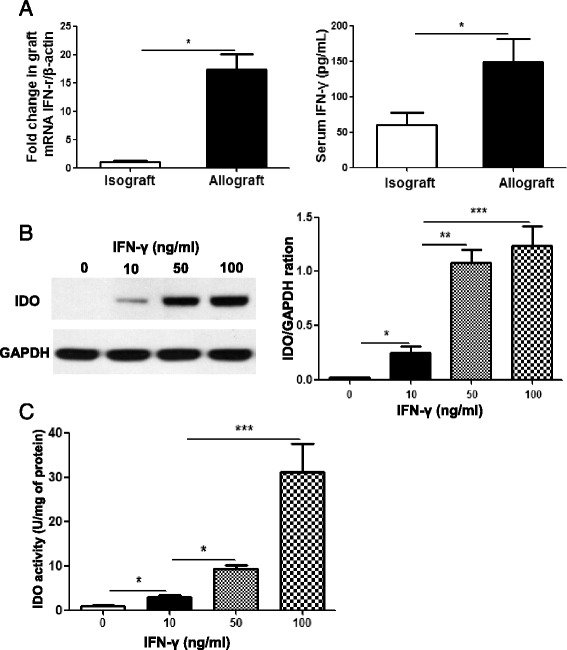
Fig. 3.

Mechanisms of increased IDO expression. a Grafts and serum samples were collected on day 7 post-transplant from the isograft and allograft mice. IFN-γ levels in the grafts were determined via RT-PCR. Serum IDO levels were quantitated via ELISA. b ASCs were stimulated with indicated concentrations of IFN-γ (10, 50 and 100 ng/ml) for 24 h. Protein lysates were extracted from the cells and the expression levels of IDO quantitated by Western blot analysis. GAPDH was used as loading control. c ASCs were lysed after IFN-γ (10, 50 and 100 ng/ml) stimulation for 24 h. Cell lysates were assayed for IDO enzymatic activity via colorimetric assay with Ehrlich’s reagent. All data are expressed as mean ± SEM; n = 4 per group. *, p < 0.05; **, p < 0.01 and ***, p < 0.001
